
You’ve spent hours perfecting your trading strategy. The setup looks beautiful. Every indicator aligns. You’re convinced this is it—your edge in the market.
Then you take it live and watch your account bleed red for three straight weeks.
Here’s the brutal truth: most traders blow up their accounts not because they lack discipline or intelligence, but because they never tested their strategy before risking real money. They’re flying blind, hoping their ideas work instead of knowing they work.
But there’s a problem. When you read about backtesting, every article assumes you’re a programmer who can write Python scripts or build complex algorithms. Most traders aren’t coders—and they shouldn’t have to be.
This guide shows you exactly how to backtest without coding. We’ll walk through manual backtesting methods, spreadsheet-based testing, and modern no-code platforms that eliminate the technical barriers. By the end, you’ll know how to validate any strategy before it touches your capital.
Let’s start with the fundamentals.
What Is Backtesting and Why Does It Matter?
Understanding Backtesting in Trading
Backtesting is testing a trading strategy on historical data to see how it would have performed in the past. Think of it as a time machine for your strategy—you’re simulating what would have happened if you’d traded your rules during previous market conditions.
The process is straightforward. You define your strategy’s rules (entry signals, exits, stop losses, position sizing), then you apply those rules to historical price data. You record every trade the strategy would have triggered. When you’re done, you calculate performance metrics like win rate, profit factor, and maximum drawdown.
Here’s what makes backtesting powerful: it costs you nothing except time, but it can save you thousands in real losses.
The Critical Benefits of Backtesting Your Strategy
Our team has watched countless traders skip this step—and we’ve watched them fail because of it. Backtesting isn’t optional. It’s the difference between gambling and trading with a genuine edge.
When you backtest properly, you gain unshakeable confidence. You know your strategy works because you’ve seen it produce positive results over hundreds of trades. You understand exactly what to expect when you face the inevitable losing streak—because you’ve already seen the drawdowns in your backtest.
You identify your statistical edge before risking a dime. Maybe your strategy has a 45% win rate but an average winner that’s three times your average loser. That’s profitable. Without backtesting, you’d panic after six losses in a row and abandon a winning system.
You also learn to stomach the psychological reality of drawdowns. Every strategy—even the best ones—go through rough patches. When you’ve backtested and seen that your strategy historically recovered from 15% drawdowns, you don’t panic when it happens live.
Backtesting vs Paper Trading vs Forward Testing
Let’s clear up the confusion. These three terms get used interchangeably, but they’re different tools.
Backtesting uses historical data. You’re looking backward at what already happened. It’s fast—you can test years of data in hours—but it comes with the risk of look-ahead bias (more on that later).
Paper trading is testing your strategy in real-time with simulated money. You’re trading live market conditions without risk. It’s slower but eliminates look-ahead bias and reveals execution challenges you’ll face with real money.
Forward testing is the same as paper trading—some traders use the terms interchangeably. The key is that you’re testing forward in time, not backward.
Here’s how we recommend using all three: Backtest first to validate your edge exists. Then forward test (paper trade) for at least 30-50 trades to bridge the gap between theory and reality. Finally, start with tiny position sizes using real money. This trilogy builds genuine confidence.
Before You Start: The Non-Negotiable Prerequisites
You Must Have a Defined Trading Strategy
Stop right here if your strategy isn’t crystal clear. Vague ideas like “buy the dips” or “trade momentum” will destroy your backtest accuracy—and your account.
Your trading plan must answer seven questions before you can backtest anything:
- What’s your setup? (e.g., “Stock breaks above 20-day high on volume 50% above average”)
- What’s your entry trigger? (e.g., “Enter on close above breakout candle”)
- Where’s your stop loss? (e.g., “1 ATR below entry”)
- How will you exit winners? (e.g., “Trail stop 2 ATR below highest close”)
- What’s your position size? (e.g., “1% of capital at risk per trade”)
- What timeframe are you trading? (e.g., “Daily charts”)
- Which markets qualify? (e.g., “US stocks priced $10-$100 with average volume > 500K shares”)
If you can’t answer these questions precisely, you can’t backtest. You’ll just end up cherry-picking winning trades and fooling yourself into thinking you have an edge.
Setting Up Your Backtesting Environment
You don’t need much. A charting platform (TradingView, your broker’s charts, even free options like FinViz), historical price data, and a way to record your results (we’ll cover spreadsheet templates shortly).
The time commitment varies wildly. Manual backtesting a daily chart strategy might take 10-20 hours for 100 trades. A 5-minute scalping strategy could take 50+ hours. No-code platforms can compress this dramatically—more on that in a moment.
Expect to invest real time here. But remember: 20 hours of backtesting beats a 20% drawdown any day.
Manual Backtesting: The Hands-On Approach

What Is Manual Backtesting?
Manual backtesting is exactly what it sounds like. You scroll through historical charts candle by candle, identify every setup your strategy would have triggered, and record the results.
It’s tedious. It’s time-consuming. And for learning your strategy inside and out? It’s absolutely unbeatable.
When you manually backtest, you’re training your brain to recognize patterns in real-time. You see how your setup looks in different market conditions. You spot the false signals before they cost you money. This hands-on pattern recognition is something automated testing can never replicate.
Step-by-Step Manual Backtesting Process
Here’s exactly how our team manual backtests strategies:
Step 1: Select your market and timeframe. Start with one instrument. Don’t try to test 10 stocks at once—you’ll burn out and cut corners.
Step 2: Load your chart and scroll back. Go back at least 200 candles (or whatever gives you your minimum sample size). Make sure all your indicators and drawing tools are visible.
Step 3: Hide the future. This is critical. In TradingView, use the replay feature. On most platforms, you can physically cover the right side of your screen or scroll so future candles aren’t visible. You must not see what happens next when you’re evaluating a setup.
Step 4: Move forward one candle at a time. Press the right arrow key (or F12 on some platforms). After each candle, ask: “Does my strategy have a valid setup here?” Be brutally honest. No fudging.
Step 5: When a setup appears, record everything. Write down (or screenshot): entry price, stop loss level, exit price when the trade closes, date, and the outcome in R-multiples (more on that shortly). Use a spreadsheet—we have a template coming up.
Step 6: Continue until you hit your sample size. Don’t stop at 20 trades. Don’t stop at 50. Aim for at least 100. More is better.
Step 7: Calculate your metrics. Once your sample is complete, analyze the data. Win rate, profit factor, average R, maximum drawdown—all the metrics that tell you if you have a real edge.
Common Manual Backtesting Pitfalls
The biggest mistake? Look-ahead bias. It’s when you unconsciously let future information leak into your current decision. You see that price rallied huge after a setup, so you convince yourself you “would have taken that trade”—even though the actual signal was marginal.
Your brain is a pattern-recognition machine that loves finding what it expects to find. Combat this by sticking to your written rules religiously. If the rule says “price must close above resistance,” and it closed one tick below? That’s not a valid signal. No exceptions.
Cherry-picking is the evil twin of look-ahead bias. You remember all the massive winners but conveniently forget the four consecutive losers. This is why you must record every trade the strategy generates, not just the ones you like.
Stay honest with yourself. Backtesting is where you learn the truth about your strategy—not where you build false confidence.
Spreadsheet-Based Backtesting: Excel and Google Sheets

Why Spreadsheets Are Perfect for Backtesting
Spreadsheets are the duct tape of trading—infinitely flexible and universally accessible. Unlike proprietary backtesting software that locks you into their metrics and format, a spreadsheet does exactly what you want.
Most backtesting platforms won’t track the specific data points you care about. Maybe you want to separate setups by day of week. Maybe you want to tag trades by volatility regime. With a spreadsheet, you can track anything.
Plus, spreadsheets are free. Excel comes with most computers. Google Sheets is completely free and cloud-based. No monthly subscriptions to specialized software.
Building Your Backtesting Spreadsheet
Start with these essential columns:
- Trade # – Sequential numbering
- Date – When the setup triggered
- Symbol – What you traded
- Entry Price – Where you entered
- Stop Loss – Your risk level
- Exit Price – Where the trade closed
- Shares/Contracts – Position size
- P&L ($) – Dollar profit or loss
- R-Multiple – Profit/loss relative to your initial risk
- Setup Notes – Why you took it, quality rating
The R-multiple column is critical. It normalizes every trade relative to your risk. If you risked $100 and made $200, that’s +2R. If you risked $100 and lost $50, that’s -0.5R. This metric lets you compare trades of different sizes.
Here are some formulas you’ll need:
Calculate P&L: =(Exit Price - Entry Price) * Shares (flip signs for shorts)
Calculate R-Multiple: =(Exit Price - Entry Price) / (Entry Price - Stop Loss) (for longs)
Calculate Win Rate: =COUNTIF(P&L column, ">0") / COUNT(P&L column)
Calculate Average Win: =AVERAGEIF(P&L column, ">0")
Calculate Average Loss: =AVERAGEIF(P&L column, "<0")
Key Metrics to Track in Your Spreadsheet
Let’s break down the metrics that actually matter:
Win Rate is the percentage of winning trades. A 60% win rate means 6 out of every 10 trades are profitable. But here’s the thing—win rate alone means nothing. You can have a 70% win rate and still lose money if your winners are tiny and your losers are massive.
Profit Factor is your total gross profit divided by total gross loss. If you made $10,000 on winners and lost $5,000 on losers, your profit factor is 2.0. Our team uses 1.5 as a minimum benchmark—anything below that is typically not robust enough for live trading.
Expectancy is your average dollar amount per trade. Add up all your P&L and divide by number of trades. If your expectancy is $45, you expect to make $45 per trade over the long run. This number must be positive after accounting for commissions and slippage.
Maximum Drawdown is the largest peak-to-trough decline in your account. It’s measured in percentage terms. If your account went from $10,000 to $7,500 before recovering, that’s a 25% drawdown. This tells you the pain you’ll need to endure during rough patches.
Average Risk/Reward Ratio is how your average winner compares to your average loser. If you make $300 on average winners and lose $100 on average losers, that’s 3:1. This metric explains how you can be profitable with a “low” win rate—if your wins are much bigger than your losses.
Free Backtesting Spreadsheet Resources
Several trading educators offer free backtesting templates. JumpStart Trading provides a Google Sheets template with most formulas pre-built. Trading Heroes offers a simpler version. Both are solid starting points—just make a copy and customize them to track your specific metrics.
Don’t reinvent the wheel. Start with a template, then add columns for whatever unique data you want to track.
No-Code Backtesting Platforms: The Modern Solution

Why No-Code Platforms Are Game-Changers
Here’s where backtesting gets powerful—and fast. No-code platforms eliminate the two biggest problems with manual testing: look-ahead bias and time consumption.
Look-ahead bias vanishes because the software doesn’t “know” what happens next when it’s evaluating each bar. It processes data sequentially, just like live trading. No peeking. No cheating.
The time savings are dramatic. What takes 20 hours manually can happen in 20 minutes. You can test multiple variations of your strategy, compare different parameters, and get professional-grade analytics without writing a single line of code.
TradingView: Replay and Strategy Tester
TradingView has two features for backtesting. The first is Bar Replay, which is essentially high-quality manual backtesting. You can rewind any chart to any historical date, then play it forward candle by candle. It tracks your simulated trades and calculates performance. Perfect for discretionary traders who want to practice pattern recognition.
The second feature is the Strategy Tester, which uses Pine Script—TradingView’s programming language. But here’s what most traders don’t know: Pine Script has an auto-suggest feature that’s almost like coding in plain English. You can often build simple strategies by selecting from dropdown menus and adjusting parameters. It’s not completely no-code, but it’s close enough for traders willing to climb a small learning curve.
Our team uses TradingView replay extensively for manual testing of our discretionary pullback strategies. The platform is smooth, the charts are excellent, and the replay feature is free on paid plans.
Trade Ideas: AI-Powered Backtesting Without Code
If you’re serious about backtesting—especially for pattern-based or scanner-driven strategies—Trade Ideas is the platform our team recommends most often.
Here’s why Trade Ideas shines for non-coders: it’s built around a visual Strategy Builder that uses plain-English logic. You’re not coding—you’re checking boxes and selecting conditions from dropdowns. “If stock breaks above 20-day high AND volume is 150% of average THEN enter long.” No syntax. No programming errors. Just logical rules.
The real power? Trade Ideas can backtest those strategies using years of historical scanner data. This is unique. You’re not just backtesting a single stock—you’re seeing which stocks your scanner would have flagged each day, then testing your strategy on those candidates. This mirrors how you’ll actually trade: scanning for opportunities, then executing your strategy on what appears.
The platform provides detailed performance analytics: equity curves, win rates, profit factors, Monte Carlo simulations, and more. Everything you need to validate your edge. Plus, because Trade Ideas is primarily a real-time scanner, you can seamlessly transition from backtesting to live scanning once you’ve proven your strategy works.
Full transparency: We’re recommending Trade Ideas because it’s genuinely the best no-code solution for scanner-based strategies. It’s not the cheapest option, but when you’re talking about protecting your trading capital, the subscription pays for itself after it saves you from one bad strategy.
Other No-Code Platforms Worth Exploring
MetaTrader 4/5 has a strategy tester for Expert Advisors (EAs). There are EA builders like EA Builder that let you create EAs using dropdown menus and visual logic—no MQL programming required. MT4 is popular among Forex traders and it’s free from most brokers.
Amibroker with AFL Code Wizard takes another approach. The wizard converts plain English sentences into Amibroker’s coding language. “Close is greater than moving average” becomes executable code automatically. Amibroker is powerful but has a steeper learning curve than Trade Ideas.
TrendSpider offers backtesting for technical pattern strategies. You can define your setup criteria, and TrendSpider will scan historical charts for matching patterns and show you how they performed. It’s excellent for pattern traders—breakouts, triangles, support and resistance levels.
BacktestZone and Capitalise.ai are newer platforms built specifically for no-code backtesting. Both use visual builders and support stocks, forex, and crypto. They’re worth exploring if you want something purpose-built for backtesting rather than a platform that offers it as a secondary feature.
| Platform | Best For | Difficulty | Cost |
|---|---|---|---|
| TradingView | Discretionary patterns | Easy | $15-60/mo |
| Trade Ideas | Scanner-based strategies | Easy | $118-228/mo |
| MetaTrader 4/5 | Forex automation | Medium | Free |
| Amibroker | Systematic strategies | Medium-Hard | $279-369 one-time |
| TrendSpider | Technical patterns | Easy | $39-129/mo |
| BacktestZone | Multi-market testing | Easy | Free-$49/mo |
Advanced Backtesting Concepts (For Serious Traders)
Understanding Statistical Significance
Here’s where most traders go wrong: they backtest 20 trades, see a positive result, and assume they’ve found their edge. This is gambling with extra steps.
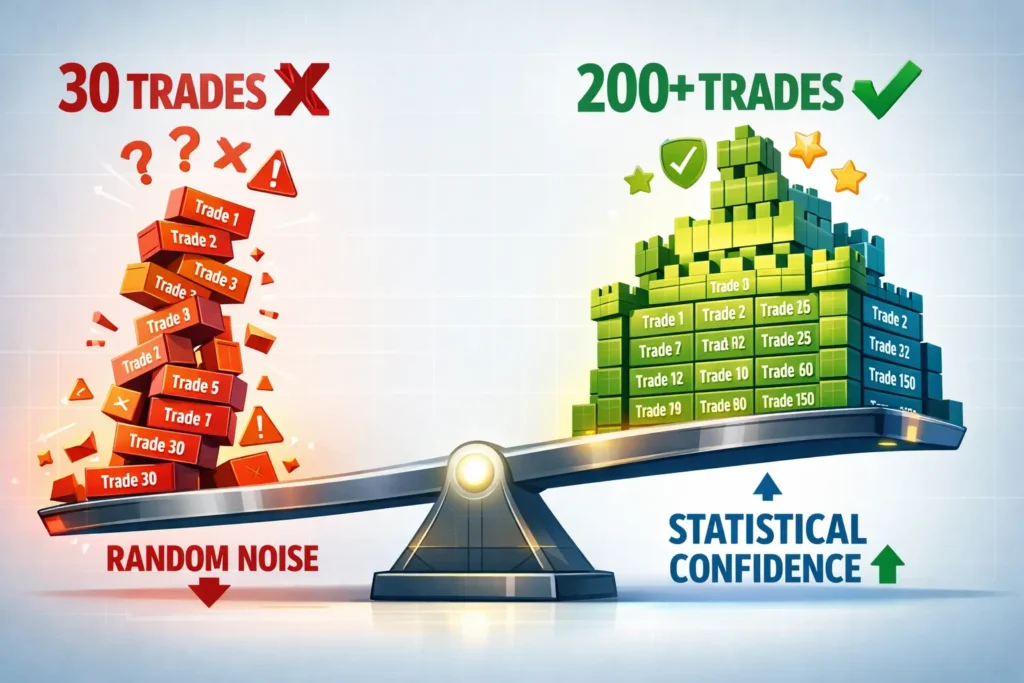
You need a minimum of 30 trades to begin drawing basic statistical conclusions. Why? The Central Limit Theorem from statistics says that with about 30 samples, the distribution of your results starts to approximate a normal distribution. This enables statistical testing.
But 30 is just the floor. For genuine confidence, you want 100-200+ trades. Think about it: if you have a 60% win rate strategy and you test 20 trades, you could get 14 winners (70% win rate) or 10 winners (50% win rate) purely by chance. With 200 trades, the variance smooths out and you see the strategy’s true performance.
Small sample sizes are how traders fool themselves into thinking curve-fit nonsense is a legitimate edge. Don’t make that mistake.
In-Sample vs Out-of-Sample Data
Professional traders split their data into two chunks: in-sample and out-of-sample.
In-sample data is your training set. This is where you develop and optimize your strategy. Maybe you test different moving average lengths or stop loss distances. You use this data to build your rules.
Out-of-sample data is your testing set—completely unseen data that you didn’t use during development. After you’ve finalized your strategy on in-sample data, you test it on out-of-sample data to see if it actually works on “new” price action.
The typical split is 70-80% in-sample, 20-30% out-of-sample. If your strategy performs well on in-sample data but collapses on out-of-sample data, you’ve curve-fit. The strategy memorized the in-sample data’s random noise instead of capturing a genuine market behavior.
This technique prevents the single biggest mistake in backtesting: creating a system that’s perfectly optimized for the past but useless in the future.
Monte Carlo Simulation for Robustness Testing
Monte Carlo analysis is a stress test for your strategy. Instead of testing trades in the order they occurred, you randomly reshuffle the trade sequence thousands of times. This shows you all the different equity curve paths your strategy could have taken.
Why does this matter? Your actual backtest might have gotten lucky with trade sequencing. Maybe all your biggest winners came early and built a cushion before the losers hit. In a different sequence, you might have faced max drawdown immediately and blown up.
Monte Carlo simulation reveals the range of possible outcomes. It answers: “What if I start trading this strategy during a bad stretch?” Most serious backtesting platforms include Monte Carlo tools. If your strategy’s worst-case Monte Carlo scenario is still acceptable, you’ve got a robust system.
Testing Across Different Market Conditions
Some strategies look amazing in trending markets but get shredded in choppy ranges. Others work great in low volatility but fail when the VIX spikes.
You must test your strategy in different market regimes: bull markets, bear markets, sideways grind. High volatility periods and low volatility periods. The only way to know how your strategy adapts is to make sure your historical data sample includes variety.
If you’re only backtesting the 2020-2023 period—which was predominantly bullish with occasional sharp corrections—you haven’t seen how your strategy performs in a sustained bear market like 2008. Be honest about your data limitations.
Interpreting Your Backtest Results Like a Pro
Essential Performance Metrics Explained
Win Rate – What percentage is “good”? It depends on your average R-multiple. A 40% win rate is excellent if your average winner is 3R and average loser is 1R. A 65% win rate might be terrible if your winners are 0.5R and losers are 2R. Stop obsessing over win rate in isolation.
Profit Factor – Our benchmark is 1.5 minimum for a strategy we’d trade live. Below 1.5, the strategy lacks the cushion to survive real-world slippage and commission costs. Above 2.0 is strong. Above 3.0, you’re either onto something special or you’ve curve-fit.
Average Risk/Reward Ratio – This explains how win rate and profitability interact. A 2:1 average RR means your average winner is twice your average loser. This is solid. Anything above 1.5:1 can be profitable with modest win rates. Below 1:1, you need high win rates to survive.
Maximum Drawdown – This is the psychological pain threshold. A 30% drawdown means at some point, you’re looking at your account down 30% from its peak. Most traders can’t stomach that. Our team aims for strategies with maximum historical drawdowns under 20%. Know your pain tolerance.
Sharpe Ratio – This is a risk-adjusted return metric. It considers both your return and the volatility (bumpiness) of getting there. A ratio above 1.0 is good. Above 2.0 is excellent. Above 3.0 is rare. The higher the Sharpe ratio, the more efficiently you’re generating returns relative to risk taken.
Expectancy – This is your “edge per trade” in dollar terms. If your expectancy is $50 per trade after costs, you know that over 100 trades you expect to make about $5,000. Positive expectancy means you have an edge. Negative expectancy means you’re paying for lessons.
Red Flags That Mean Your Strategy Doesn’t Work
Insufficient sample size – If you only have 30-40 trades, you don’t have enough data. Period. Keep backtesting.
Inconsistent performance across timeframes – If your strategy works on 2020-2021 data but fails on 2018-2019 and 2022-2023, it’s not robust. You’ve likely found a pattern that was unique to that specific market regime.
Over-optimization warning signs – If tiny parameter changes cause massive performance swings, you’ve curve-fit. A robust strategy should have parameter stability. Changing a moving average from 20 to 19 or 21 shouldn’t crater your results.
Unrealistic assumptions – If you’re backtesting a scalping strategy and ignoring bid-ask spreads and commission, your results are fantasy. If you’re testing illiquid stocks and assuming you can enter/exit at exact prices, you’re fooling yourself. Factor in real-world costs.
Green Lights: Signs of a Robust Strategy
Consistent performance across market conditions – Your strategy works (even if more modestly) in both bull and bear markets. It survived the 2020 Covid crash. It handled the 2022 rate-hike volatility. This consistency suggests you’ve captured a real market behavior, not noise.
Acceptable drawdown levels – Your maximum drawdown is something you can emotionally stomach. If you’re comfortable with 15% drawdowns and your max is 18%, that’s close enough. If max drawdown is 40% and you panic at 10%, this strategy isn’t for you regardless of returns.
Positive expectancy with realistic costs – After factoring in commissions, spreads, and estimated slippage, your expectancy is still positive. This is the ultimate test. Many strategies look profitable until you add real-world costs.
Logical edge explanation – You can articulate why your strategy should work. “It captures momentum continuation after earnings breakouts” or “It fades short-term extremes in volatility.” If you can’t explain your edge in one sentence, you probably don’t have one.
Avoiding the Deadly Backtesting Mistakes
Let’s walk through the six mistakes that kill otherwise promising strategies:
Mistake #1: Testing Without Defined Rules – We covered this earlier, but it’s worth repeating. Vague strategies produce meaningless results. “Trade breakouts” isn’t specific enough. “Enter when price closes above 20-day high with volume 2x average” is testable.
Mistake #2: Cherry-Picking Data or Setups – Only backtesting bull markets. Conveniently “forgetting” to log the ugly losses. Starting your backtest right after a major crash (when everything rallies). These sins will haunt you in live trading.
Mistake #3: Ignoring Transaction Costs – Every trade has costs. Commission, spread, slippage. For a $10,000 stock position, you might pay $5-10 in commissions plus another $10-30 in spread and slippage depending on liquidity. That’s $40 per round trip. Over 100 trades, that’s $4,000—which could wipe out your entire edge.
Mistake #4: Over-Optimizing for Past Performance – Also called curve-fitting. This is when you tweak parameters until you get a perfect equity curve on historical data. The strategy has memorized the past, not learned from it. The cure: keep your strategy simple and validate on out-of-sample data.

Mistake #5: Insufficient Sample Size – Twenty trades tells you nothing. Fifty trades is barely a start. Get to 100-200+ before you draw conclusions. Yes, it takes time. Do it anyway.
Mistake #6: Skipping Forward Testing – Backtesting shows you what might work. Forward testing (paper trading) proves it. Never go from backtest straight to live money. Bridge the gap with real-time simulation first.
After Backtesting: Forward Testing and Going Live
What Is Forward Testing?
Forward testing is running your strategy in real-time with a demo or paper trading account. You’re executing your rules as market conditions unfold—no hindsight, no replays. Just you and the live market.
This reveals all the things backtesting can’t: execution challenges, emotional responses, rule ambiguity. When a setup appears in real-time, is it actually clear-cut? Or do you find yourself second-guessing? Forward testing exposes these gaps.

The Forward Testing Process
Our team recommends a minimum of 30-50 trades in forward testing before going live. For daily chart strategies, this might take 3-6 months. For intraday strategies, maybe 2-4 weeks. Don’t rush it.
Track the same metrics you tracked in your backtest: win rate, profit factor, average R, drawdown. Compare your forward test results to your backtest results. They should be similar. If forward testing is dramatically worse, one of three things happened: you curve-fit, market conditions have changed, or you’re not executing your rules consistently.
Keep a detailed journal. Not just entry/exit prices—write down your emotional state, any rule ambiguity, execution challenges. These notes are gold for refining your strategy before real money is on the line.
Making the Leap to Live Trading
Once you’ve got 50+ forward test trades that match your backtest expectations, it’s time to go live—but start small. We’re talking risk 0.25% per trade instead of your backtested 1%. Trade one contract instead of five. Get your feet wet without drowning.
The psychological shift from paper money to real money is massive. Most traders underestimate it. By starting tiny, you accrue real-money experience without catastrophic consequences. After 30-50 live trades at quarter-size, bump up to half-size. Then full size.
Continue tracking your performance. Compare live results to forward test and backtest. If live trading matches your testing, congratulations—you’ve got a genuine edge. If not, back to the drawing board.
And here’s the final piece of advice: maintain discipline. All the backtesting in the world won’t help if you abandon your rules during a losing streak. Trust the process you’ve validated.

Frequently Asked Questions
Can you backtest without coding?
Quick Answer: Yes, absolutely. You have three main options: manual backtesting (scrolling through charts and recording trades by hand), spreadsheet-based backtesting using Excel or Google Sheets, and no-code platforms like Trade Ideas, TradingView, and TrendSpider that use visual builders instead of programming languages.
Manual backtesting requires nothing but a charting platform and a spreadsheet to record your results. It’s time-intensive but excellent for learning your strategy deeply. No-code platforms dramatically speed up the process by automating the data processing while letting you define strategy rules through dropdown menus and checkboxes rather than code. The combination of these methods gives you everything you need to validate trading strategies without touching a programming language.
Key Takeaway: Coding skills are helpful but absolutely not required to backtest effectively. The tools exist to backtest without writing a single line of code.
How do I manually backtest a trading strategy?
Quick Answer: Manual backtesting involves scrolling through historical charts candle by candle, identifying every trade your strategy would have generated, and recording the results. Start by loading a chart for your chosen instrument, scroll back to your starting point (at least 200 bars), then advance one candle at a time using the arrow keys or a replay feature. When your strategy’s criteria are met, record the entry, stop loss, exit, and outcome in a spreadsheet. Continue until you’ve accumulated at least 100 trades, then calculate your win rate, profit factor, and other key metrics.
The critical rule: never look ahead. Use a replay feature or physically cover future price action so you can’t see what happens next. This prevents look-ahead bias, where you unconsciously make decisions based on future information. It’s tedious work, but the pattern recognition you develop is invaluable for live trading. Budget 10-30 hours depending on your strategy’s timeframe and frequency.
Key Takeaway: Manual backtesting is systematic, methodical work—define your rules, move forward one candle at a time, record every valid setup without cheating, and build a data set large enough to be meaningful.
What are the best no-code backtesting platforms?
Quick Answer: For scanner-based and pattern recognition strategies, Trade Ideas leads the pack with its visual Strategy Builder and historical scanner data. For discretionary pattern trading, TradingView’s Bar Replay and simplified Pine Script interface work well. TrendSpider excels at technical pattern backtesting with automatic pattern detection. For Forex traders, MetaTrader 4/5 with EA Builder tools provide accessible automation. BacktestZone and Capitalise.ai are newer platforms built specifically for no-code backtesting across multiple asset classes.
Each platform has strengths. Trade Ideas is best if you use scanners to find trade candidates. TradingView is ideal for chart-based discretionary strategies. TrendSpider specializes in pattern recognition. Choose based on your trading style, not random recommendations. All of these platforms let you build and test strategies without programming, though some have steeper learning curves than others.
Key Takeaway: Trade Ideas gets our team’s highest recommendation for no-code backtesting, especially for scanner-driven strategies, but TradingView and TrendSpider are excellent alternatives depending on your specific needs.
Can I backtest using Excel or Google Sheets?
Quick Answer: Yes, and spreadsheets are one of the best tools for backtesting because they’re infinitely customizable. You manually record each trade’s details (date, entry price, exit price, P&L, R-multiple) as you identify setups on your charts, then use spreadsheet formulas to calculate performance metrics like win rate, profit factor, expectancy, and maximum drawdown. Free templates are available from trading educators like JumpStart Trading and Trading Heroes—start with a template rather than building from scratch.
Spreadsheets excel at tracking custom data points that proprietary platforms don’t support. Want to tag trades by day of week, volatility regime, or earnings proximity? Easy in a spreadsheet, impossible in most platforms. The limitation is that spreadsheets require you to identify and enter trade data manually—they don’t automate the backtesting process. Think of spreadsheets as your recording and analysis tool, paired with manual chart analysis for identifying trades.
Key Takeaway: Excel and Google Sheets are powerful, free, and flexible backtesting tools, especially when combined with manual chart analysis, though they require you to do the trade identification work yourself.
How many trades do I need to backtest?
Quick Answer: Minimum 30 trades for basic statistical validity, but 100-200+ trades for genuine confidence in your strategy. This recommendation comes from statistical principles—with 30 samples, your results begin to approximate a normal distribution (Central Limit Theorem), allowing basic statistical testing. However, 30 trades aren’t enough to fully characterize a strategy’s performance across different market conditions and random variance.
At 100-200 trades, the variance smooths out and you see the strategy’s true performance characteristics. Small sample sizes are dangerous because variance can make random garbage look like a profitable edge. A 60% win rate strategy might show 75% wins over 20 trades purely by luck, leading you to trade a strategy with false confidence. Don’t shortcut this. Insufficient sample size is how traders blow up accounts on strategies that “worked” in limited testing.
Key Takeaway: Aim for a minimum of 100 trades, ideally 200+, to have statistical confidence that your results aren’t just random luck—30 trades is the bare minimum floor, not the target.
How do you know if backtest results are reliable?
Quick Answer: Reliable backtest results are consistent across different time periods and market conditions, achieved with sufficient sample size (100+ trades), tested on out-of-sample data, and calculated with realistic transaction costs included. If your strategy performs well only in bull markets or collapses when you test data it hasn’t seen before, it’s not reliable—it’s curve-fit to specific conditions.
Red flags include tiny sample sizes, huge performance differences between test periods, extreme sensitivity to parameter changes (changing a moving average from 20 to 19 crashes results), and unrealistic assumptions about execution. Green lights include consistent positive expectancy across various market regimes, logical explanation for why the edge exists, acceptable maximum drawdown, and parameter stability. The ultimate test: forward test with paper trading. If real-time results match your backtest, you’ve got reliable results.
Key Takeaway: Reliability comes from consistency across different data sets and time periods, sufficient sample size, realistic costs, and successful forward testing validation—one good backtest isn’t enough.
What metrics should I track when backtesting?
Quick Answer: The essential metrics are win rate (percentage of winning trades), profit factor (gross profit divided by gross loss), expectancy (average dollar amount per trade), maximum drawdown (worst peak-to-trough decline), average risk/reward ratio (average win vs average loss size), and Sharpe ratio (risk-adjusted return measure). These six metrics give you a complete picture of your strategy’s performance and risk characteristics.
Win rate alone is meaningless—a 40% win rate with 3:1 reward/risk ratio is highly profitable. Profit factor shows overall efficiency (target 1.5+ minimum). Expectancy tells you your dollar edge per trade. Maximum drawdown reveals the psychological pain you’ll endure. Sharpe ratio combines return and volatility into one risk-adjusted metric. Track all of them. Focus especially on expectancy (must be positive after costs) and maximum drawdown (must be tolerable for your psychology).
Key Takeaway: Track win rate, profit factor, expectancy, maximum drawdown, average R-multiple, and Sharpe ratio as your core six metrics—together they reveal if you have a genuine, tradeable edge.
What’s the difference between backtesting and paper trading?
Quick Answer: Backtesting uses historical data to test what would have happened in the past, while paper trading tests your strategy in real-time with simulated money. Backtesting is faster—you can test years of data in hours—but carries the risk of look-ahead bias. Paper trading is slower but eliminates hindsight bias and reveals execution challenges, emotional responses, and rule ambiguity that only appear in real-time conditions.
The proper sequence is backtest first to verify your edge exists historically, then forward test (paper trade) for at least 30-50 trades to bridge the gap between theory and live execution. Backtesting proves the concept. Paper trading proves you can execute it. Many strategies that backtest beautifully fall apart in paper trading because the signals are ambiguous in real-time or execution is problematic. Use both methods sequentially—not as either/or.
Key Takeaway: Backtesting looks backward at historical data for speed and analysis; paper trading moves forward in real-time for execution validation—you need both to fully prove a strategy works.
How do I avoid curve fitting in backtesting?
Quick Answer: Avoid curve fitting by keeping your strategy simple (fewer parameters means less opportunity to over-optimize), testing on out-of-sample data that wasn’t used during development, avoiding excessive parameter optimization, and ensuring parameter stability (small parameter changes shouldn’t crater results). Curve fitting happens when your strategy memorizes past random noise instead of capturing genuine market behavior—the antidote is simplicity and proper validation.
Use the 80/20 rule: develop and optimize on 80% of your data (in-sample), then test on the remaining 20% (out-of-sample) that the strategy has never “seen.” If performance collapses on out-of-sample data, you’ve curve-fit. Walk-forward analysis takes this further by continuously rolling your optimization and testing windows forward. Keep your rules logical and explainable. If you can’t articulate why your edge should work in one sentence, you probably don’t have a real edge.
Key Takeaway: Simplicity, out-of-sample testing, and parameter stability are your weapons against curve fitting—if your strategy only works on the data you optimized it for, it’s worthless.
Can TradingView backtest strategies without code?
Quick Answer: TradingView offers Bar Replay for manual backtesting without any coding—you simply rewind a chart and play it forward candle by candle while the platform tracks your simulated trades. For automated backtesting, TradingView’s Strategy Tester requires Pine Script, which is programming, but it’s simpler than most languages and includes helpful auto-suggest features that make building basic strategies more accessible than traditional coding.
The Bar Replay feature is genuinely no-code and excellent for discretionary traders who want to practice their strategy in a controlled historical environment. It’s smooth, accurate, and included with TradingView’s paid plans. For systematic traders who want to automate testing, Pine Script is easier to learn than Python or C++, and there are thousands of community scripts you can study and modify. TradingView occupies a middle ground: fully no-code for replay, low-code for automation.
Key Takeaway: TradingView’s Bar Replay is 100% no-code for manual backtesting; its automated Strategy Tester requires Pine Script which is simpler than traditional programming but not quite fully no-code.
Ready to validate your edge? Start with manual backtesting to learn your strategy deeply, then graduate to no-code platforms like Trade Ideas to accelerate your testing. Remember: every hour spent backtesting could save you thousands in live trading losses. The traders who skip this step are the ones funding the accounts of those who don’t.
Don’t be the sucker at the poker table. Backtest your strategies. Know your edge. Trade with confidence.
Article Sources
These high-authority sources provided the factual foundation for this guide:
- Wikipedia – Backtesting: Comprehensive academic overview of backtesting methodology, including Basel regulation requirements for financial institutions. Read more
- Corporate Finance Institute – Backtesting: Definition, Example, How it Works: Professional explanation of backtesting process, look-ahead bias, and institutional practices. Read more
- TheStreet – What Is Backtesting? Definition & Example: Accessible overview of backtesting for retail traders with practical examples and limitations. Read more
- QuantifiedStrategies – Curve Fitting In Trading: Detailed analysis of overfitting, curve fitting dangers, and prevention methods for systematic traders. Read more
- Build Alpha – Backtesting Trading Strategies: Comprehensive guide to performance metrics including Sharpe ratio, profit factor, and expectancy with calculator tools. Read more
- DayTrading.com – How Long Should You Test a Trading Strategy?: Statistical significance discussion covering sample size requirements and Monte Carlo analysis. Read more


