Most trading platforms want to charge you $50, $100, even $200 per month for features you’ll barely use. Here’s the thing—you don’t need to pay those subscription fees to get a professional trading dashboard. With a few free tools and a couple of hours of setup, you can build a custom dashboard that tracks everything you need: real-time prices, your positions, P&L calculations, and risk metrics—all without spending a dime.
We’re talking Google Sheets as your foundation, TradingView for professional charting, free market data APIs for live prices, and even AI-powered stock screening. This isn’t about cutting corners. This is about taking complete control of your trading infrastructure without the monthly bleed.
In this guide, we’ll walk you through building a fully functional custom trading dashboard from scratch. You’ll learn which free tools to use, how to connect them, and how to customize everything to match your exact trading style. By the end, you’ll have a dashboard that would cost thousands if you hired someone to build it—and you’ll own every piece of it.

Why Build Your Own Trading Dashboard?
Let’s be clear about what we’re up against.
The True Cost of Pre-Built Platforms
Premium trading platforms hit you with subscription fees that add up fast. A typical “professional” setup might run $150-300 per month when you factor in data feeds, premium charting, and advanced features. That’s $1,800-3,600 per year—money that should be growing your account, not funding software companies.
Even worse? You’re paying for features bundled together whether you use them or not. Need good charts? Great, but you’re also paying for the screener, the news feed, the social trading features, and the mobile app you never open. It’s the cable TV bundle problem all over again.
When we started tracking subscription costs across our team, we found traders spending an average of $2,400 annually on tools they could replicate for free. That’s a lot of trading capital.

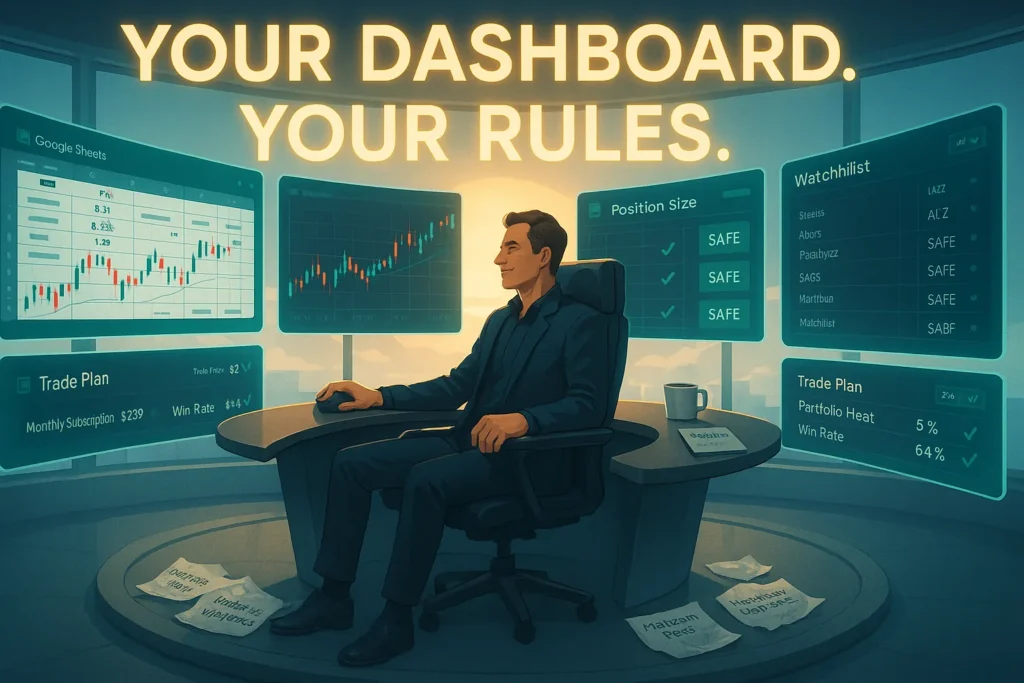
Complete Control Over Your Data and Layout
Here’s what really matters: when you build your own dashboard, you own your data. No black-box algorithms deciding what you see. No proprietary indicators you can’t modify. No layout restrictions forcing you to work the way they think you should trade.
You control every formula. Every calculation. Every color. Every alert threshold.
Want your P&L calculator to factor in your specific commission structure? Done. Need your position sizing to account for correlation risk across multiple positions? Build it. Prefer your charts arranged differently on Mondays than Fridays because your strategy changes with the week? Go for it.
The flexibility isn’t just nice to have—it’s how professional traders actually work. Our team’s approach has always been to build tools that fit our process, not twist our process to fit someone else’s tools.
Scale as You Grow Without Subscription Traps
Start simple. Add complexity as you need it. That’s the beauty of a custom dashboard built on free tools.
A new trader might start with just a watchlist and basic P&L tracking. Six months later, you’re adding position sizing calculators and risk heat maps. A year in, maybe you’re pulling data from multiple brokers and tracking correlation matrices. Your dashboard grows with you—and your costs stay at zero.
Compare that to the typical subscription model where you’re either locked into a plan that doesn’t fit or forced to “upgrade” every time you need one more feature. We’ve seen traders stick with inadequate tools for months—or pay for enterprise plans they don’t need—just because the pricing tiers don’t match their actual requirements.
When you control your infrastructure, you scale on your terms.
Essential Components of a Trading Dashboard
Before we start building, let’s talk about what actually needs to be on this dashboard. Think of this as your command center blueprint—every component serves a specific purpose in your trading process.
Real-Time Price Feed and Market Data
Your dashboard is only as good as the data flowing into it. Real-time prices are non-negotiable for day traders—even a 15-minute delay can mean the difference between catching a breakout and chasing a move that’s already over.
Here’s what you need: current price, percent change, daily high/low, volume, and ideally bid/ask spreads. If you’re trading multiple timeframes, you’ll want to see both intraday snapshots and longer-term trends at a glance.
The good news? Multiple free APIs provide this data with reasonable rate limits. We’ll show you exactly how to connect them in the technical sections below.
Stock Screening and Watchlist Management
You can’t watch every stock in the market. You need a systematic way to filter opportunities and track your candidates.
A solid watchlist does more than just list ticker symbols. It should show you why each stock made your list—was it a breakout, a pullback to support, unusual volume? What’s your planned entry, your stop level, your target? When are you reviewing this setup again?
This is where integrating a stock scanner becomes crucial. While you can build basic filters in Google Sheets, professional-grade scanning requires more firepower. That’s where Trade-Ideas comes in—their AI-powered scanner identifies setups in real-time across thousands of stocks, something that’s nearly impossible to replicate manually. The free tier gives you a taste, but serious traders find the paid version pays for itself quickly by surfacing opportunities you’d otherwise miss.
Position Tracking and P&L Calculator
Here’s where your dashboard moves from interesting to essential. You need to know, at any moment, exactly where you stand.
Current positions should display: entry price, current price, quantity, unrealized P&L, realized P&L for the day, and percentage gain/loss. If you’re holding overnight, factor in your cost basis and any commissions that haven’t been calculated yet.
Your P&L tracker should separate closed trades from open positions—don’t mix the two or you’ll lose clarity on your actual performance. We’ve found it helpful to track daily, weekly, and monthly P&L separately. Different timeframes reveal different patterns in your trading.
And look—this isn’t just about seeing green or red numbers. Tracking your P&L consistently helps you identify when you’re trading emotionally. If you’re down $500 on the day and suddenly your position sizes double, that’s revenge trading trying to sneak in. Your dashboard should make these patterns obvious. For more on managing this psychological trap, check out our guide on how to stop revenge trading after losses.
Risk Management Widgets
This is the unsexy part that keeps you in the game long enough to actually succeed.
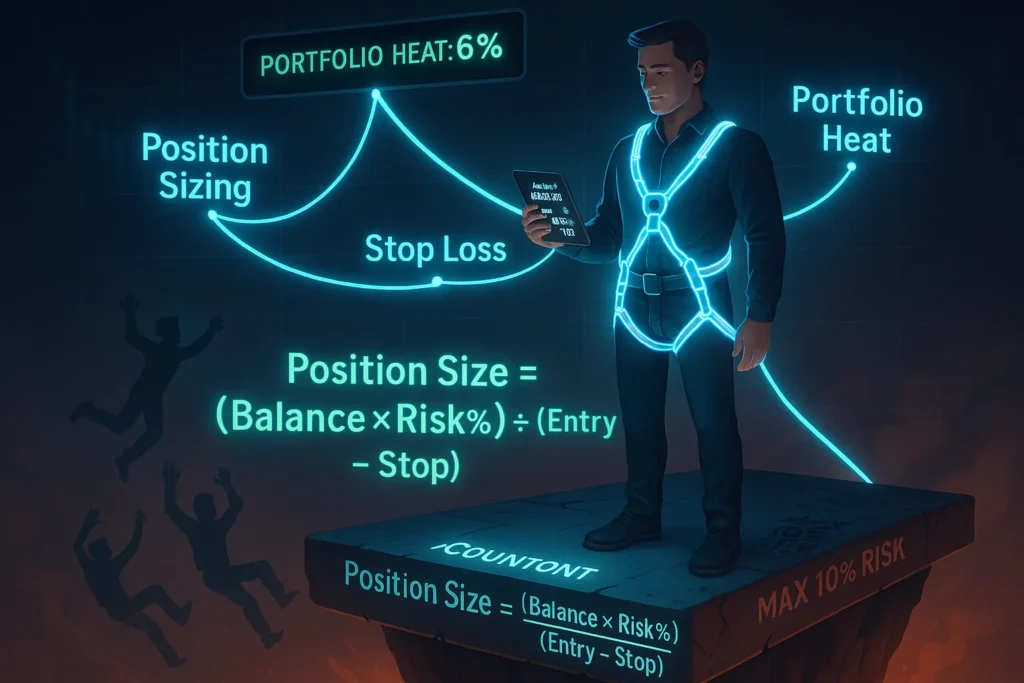
Your risk calculator needs to answer one question before every trade: “How many shares can I buy while keeping my risk at X% of my account?” That calculation should be automatic, visible, and impossible to ignore.
Our team uses a simple formula that’s displayed prominently: Position Size = (Account Balance × Risk %) ÷ (Entry Price – Stop Loss). Plug in your numbers before you click buy. This isn’t optional—this is position sizing for beginners and it’s the foundation of capital preservation.
You also want a running total of your “portfolio heat”—the total amount of capital currently at risk across all open positions. Professional traders typically cap this at 6-10% of total account value. If you’re risking 2% per trade and have five positions open, you’re at 10% portfolio heat. Take another trade and you’re potentially overextended.
A good risk widget makes these numbers impossible to ignore.
Trade Journal Integration
Your dashboard isn’t complete without a way to capture why you took each trade and what happened.
At minimum, log: ticker, date, time, entry reason (your setup), entry price, exit price, position size, P&L, and what you learned. We add a “trade grade” column—A through F—rating how well we followed our plan regardless of outcome. A losing trade that followed your rules perfectly gets an A. A winning trade where you broke three rules gets a D.
The integration part is key here. Your journal should auto-populate basic data from your position tracker—don’t manually type the same information twice. That just creates opportunities for errors and makes journaling feel like more work than it needs to be.
For a deeper dive on using your journal to identify psychological patterns and improve decision-making, see our article on trading journal psychological insights.
Your Free Trading Dashboard Toolkit
Alright, let’s talk about the actual tools you’ll use. This isn’t a comprehensive list of every free trading tool on the internet—it’s the specific stack that we’ve found works best for building a functional, professional dashboard without spending a cent.

Google Sheets: Your Foundation Platform
Google Sheets is the backbone of your custom trading dashboard, and for good reason.
First, it’s genuinely free—no trial periods, no feature limitations, no credit card required. You need a Google account, which you probably already have. That’s it.
Second, it’s cloud-based. Your dashboard lives online, which means you can access it from your phone while you’re grabbing coffee, from your tablet on the couch, or from your laptop at your desk. Everything syncs automatically. No manual saves, no version conflicts, no “I forgot to update the file” disasters.
Third—and this is the real power move—Google Sheets connects to everything. It has a built-in IMPORTDATA function that can pull data directly from URLs. It supports custom scripts through Google Apps Script if you want to get fancy. It integrates with hundreds of third-party add-ons for more specialized functionality. And it handles all the spreadsheet heavy lifting you’d expect: formulas, charts, conditional formatting, data validation.
The official Google Sheets API documentation provides all the technical specs if you want to dive deep into programmatic control. You can read, write, and manipulate spreadsheet data through RESTful API calls, which opens up possibilities for automation that go way beyond what most traders ever explore.
Is it as fast as a dedicated desktop application? No. Does it have some quirks with large datasets? Sure. But for 99% of traders, Google Sheets provides more than enough power to build a completely functional dashboard—and it costs nothing.
TradingView: Professional Charting for Free
If you’re serious about technical analysis, you need real charting tools. TradingView delivers professional-grade charts without requiring a paid subscription for the core features.
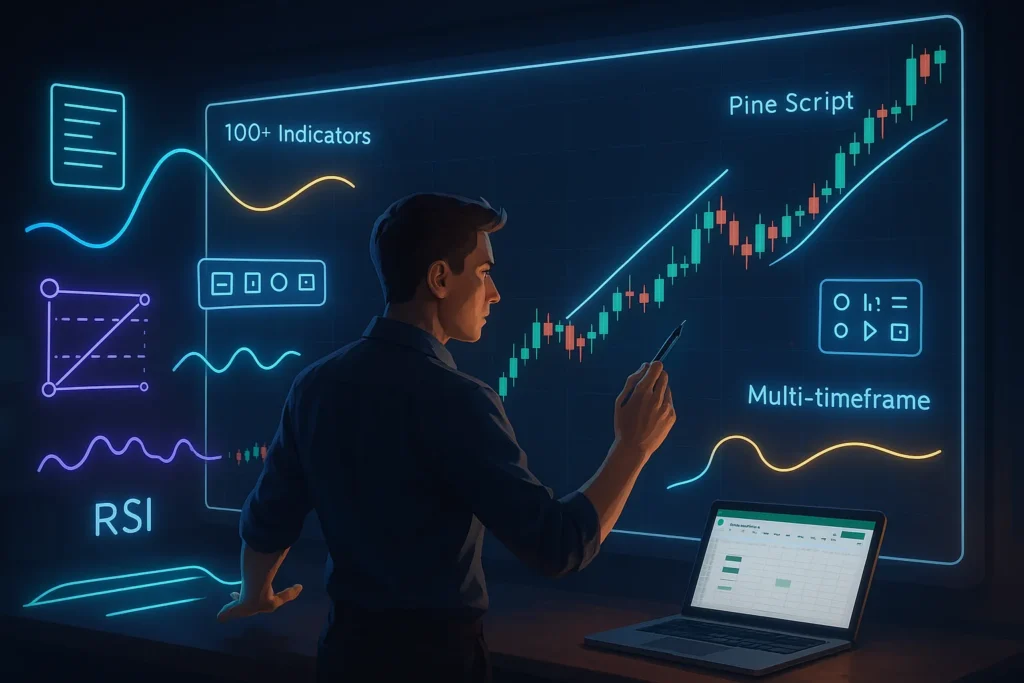
The free tier gives you access to basic charting across stocks, forex, crypto, futures—pretty much any market you want to trade. You get multiple chart types (candlesticks, line charts, bars, Heikin Ashi), dozens of built-in technical indicators, and drawing tools for trendlines, support and resistance levels, and Fibonacci retracements.
What makes TradingView especially powerful is the community aspect. Thousands of traders publish custom indicators and trading strategies written in Pine Script, TradingView’s proprietary coding language. Many of these are open source—you can see exactly how they work, modify them for your needs, or use them as templates to build your own tools.
For our dashboard purposes, TradingView serves two main roles: First, it’s your primary charting engine. You’ll embed TradingView charts into your workflow—either through browser tabs or using their embeddable widgets. Second, it’s a source of real-time market data. While TradingView’s data isn’t available through a traditional API for retail users, their charts update in real-time and can complement the data flowing into your Google Sheets dashboard.
The paid plans unlock features like more indicators per chart, more saved layouts, and faster data feeds. But the free version is completely functional for dashboard building. According to TradingView’s official feature documentation, even free users get access to over 100 technical indicators and all the core charting tools that professional traders actually use daily.
Free Market Data APIs You Can Use Today
This is where your dashboard comes alive—connecting to live market data.
Several providers offer free tiers that work perfectly for individual traders. Here’s what you need to know about the main options:
GOOGLEFINANCE Function: This is built directly into Google Sheets with no API key required. Use it like this: =GOOGLEFINANCE("AAPL","price") to get Apple’s current price, or =GOOGLEFINANCE("AAPL","changepct") for the percent change. It’s limited—you can’t get super granular historical data or obscure international stocks—but for basic U.S. equities and ETFs, it works immediately with zero setup.
Alpha Vantage: One of the more popular free APIs for financial data. You get 5 API calls per minute and 500 per day with a free API key. That’s enough to update a watchlist of 20-30 stocks throughout the trading day. They provide real-time quotes, historical data, technical indicators, and even fundamental data. The response format is JSON or CSV, which Google Sheets can parse with a bit of scripting.
Yahoo Finance (Unofficial): Yahoo doesn’t officially support an API anymore, but their data endpoints still work and many traders use them. It’s technically unsupported, which means it could change without notice, but it’s been reliable for years. You can pull historical price data, current quotes, and basic fundamental information.
Polygon.io Free Tier: Offers 5 API calls per minute on their free plan, with access to delayed stock data and some crypto data. Their documentation is clean and their free tier is genuinely useful for testing and building.
The key with free APIs is managing rate limits. If you’re hitting an API every second, you’ll get throttled fast. Instead, set your dashboard to refresh every 30-60 seconds during market hours. That’s frequent enough for decision-making but respectful enough to stay within free tier limits.
Official documentation from Google indicates that external data imported via API or IMPORTDATA functions refreshes based on your settings, but be aware that aggressive refresh rates can trigger rate limiting from the data provider’s side.
Trade-Ideas: AI-Powered Stock Screening
While you can build basic screeners in Google Sheets using filters and conditional formatting, serious real-time scanning requires dedicated software. This is one area where we recommend investing in a proper tool because the return on investment is measurable.
Trade-Ideas uses artificial intelligence to scan thousands of stocks in real-time, identifying patterns and setups as they develop. Their “Holly” AI engine can spot unusual volume, breakouts, momentum shifts, and dozens of other conditions across the entire market simultaneously—something that’s functionally impossible to replicate with spreadsheet formulas.
For dashboard integration, you’d typically run Trade-Ideas in a separate window and manually add identified opportunities to your Google Sheets watchlist. It’s not automatic integration, but the workflow is clean: Trade-Ideas finds the setups, you validate them against your strategy, and your dashboard tracks your execution.
The free trial lets you test the platform for a week. If you’re serious about day trading, it’s worth the trial just to see what professional-grade scanning looks like. The paid version starts around $50-100 per month depending on the features you need, which makes it one of the few tools we actually recommend as a worthwhile monthly cost.
Think of it this way: if Trade-Ideas identifies just one additional high-probability setup per week that you wouldn’t have found manually, and you capture even half of that move, it pays for itself instantly. Our experience suggests the actual value is much higher—especially for traders focusing on momentum, breakouts, or volume-based strategies.
Step-by-Step: Building Your Google Sheets Trading Dashboard
Enough theory. Let’s actually build this thing.
We’re going to construct a functional trading dashboard in Google Sheets from the ground up. By the end of this section, you’ll have a working template that tracks your watchlist, calculates position sizes, monitors P&L, and updates with real-time data.
Grab a coffee. Open a new Google Sheet. Let’s go.
Phase 1 – Setting Up Your Spreadsheet Structure
Organization matters. A messy dashboard is worse than no dashboard—it creates confusion when you need clarity most.
Create five separate tabs in your Google Sheet:
Tab 1: “Dashboard” – This is your main view. Everything you need to see at a glance lives here. Think of it as your cockpit.
Tab 2: “Watchlist” – Your candidate stocks and planned trades. This is where opportunities live before they become positions.
Tab 3: “Active Positions” – Your current open trades with real-time P&L tracking.
Tab 4: “Trade Journal” – Every closed trade with entry reason, exit reason, and lessons learned.
Tab 5: “Calculations” – All your backend formulas and data pulls. Keep this hidden from your main view—it’s the engine room.
On your Dashboard tab, create labeled sections for:
- Market overview (indices like SPY, QQQ, IWM)
- Today’s P&L summary
- Account risk metrics
- Top watchlist candidates
- Active position snapshot
Leave plenty of white space. Cramming everything together creates visual noise. We want surgical clarity.
Phase 2 – Connecting Real-Time Market Data
Now we bring your dashboard to life with actual market data.
Using GOOGLEFINANCE (Easiest Method):
In your Calculations tab, create a reference list of tickers you want to track. Let’s say A2 contains “AAPL”. In cell B2, use:
=GOOGLEFINANCE(A2,"price")
In C2, add the percent change:
=GOOGLEFINANCE(A2,"changepct")
In D2, get today’s high:
=GOOGLEFINANCE(A2,"high")
Copy these formulas down for each ticker in your list. Now you have live data updating automatically. Google Sheets refreshes GOOGLEFINANCE data roughly every few minutes during market hours—not tick-by-tick, but frequent enough for any trading style beyond pure scalping.
Using External APIs (More Control):
For more flexibility, use the IMPORTDATA or IMPORTXML functions to pull from external APIs.
Here’s an example using Alpha Vantage. First, get your free API key from their website. Then use:
=IMPORTDATA("https://www.alphavantage.co/query?function=GLOBAL_QUOTE&symbol=AAPL&apikey=YOUR_API_KEY")
The response comes back as a CSV or JSON that you’ll need to parse. Google Sheets handles CSV format natively—just point IMPORTDATA at the URL and it populates the cells automatically.
For JSON responses, you’ll need a small Google Apps Script function or a third-party add-on like API Connector (free for basic usage) to parse the data into readable cells.
Pro Tip: Don’t call APIs directly from your Dashboard tab. Pull all data into your Calculations tab first, then reference those cells in your Dashboard. This keeps things cleaner and makes troubleshooting easier.
Phase 3 – Creating Your Watchlist Tracker
Your watchlist is your opportunity pipeline. Let’s make it functional.
On your Watchlist tab, create columns for:
- Ticker
- Current Price (pulled from your Calculations tab)
- % Change Today
- Entry Plan (the price you’re waiting for)
- Stop Loss
- Target
- Risk/Reward Ratio (calculated automatically)
- Setup Type (breakout, pullback, reversal, etc.)
- Notes
Use data validation to create dropdown menus for Setup Type—this keeps your entries consistent and makes filtering easier later.
For the Risk/Reward Ratio, use a simple formula:
=(Target - Entry Plan) / (Entry Plan - Stop Loss)
You want to see at least 2:1 on any setup you’re seriously considering. Anything less means your winners need to be too perfect to overcome inevitable losers. For more on why this matters, see our guide on understanding the risk/reward ratio.
Add conditional formatting to highlight stocks that meet your criteria. For example:
- Turn the row green if Risk/Reward > 3
- Turn it yellow if Risk/Reward is between 2-3
- Turn it red if Risk/Reward < 2
This visual feedback helps you quickly scan your watchlist and prioritize the best setups.
Phase 4 – Building Position and P&L Calculators
This is the heart of your risk management system.
Position Size Calculator:
Create a dedicated section on your Dashboard or in your Calculations tab. You need four inputs:
- Account Balance (cell B2, for example)
- Risk % per trade (cell B3, typically 1-2%)
- Entry Price (cell B4)
- Stop Loss Price (cell B5)
In cell B6, calculate your position size:
=(B2*B3)/(B4-B5)
This tells you exactly how many shares to buy while keeping your dollar risk at your specified percentage. Before every trade, plug in your entry and stop, and this formula does the math.
P&L Tracker for Active Positions:
On your Active Positions tab, set up columns:
- Ticker
- Entry Price
- Current Price (pulled from Calculations tab)
- Quantity
- Unrealized P&L:
=(Current Price - Entry Price) * Quantity - % Gain/Loss:
=(Current Price - Entry Price) / Entry Price
At the bottom of your P&L column, sum the total unrealized P&L. This is your real-time snapshot of where you stand.
Add a cell that shows your total portfolio heat—the sum of all risk amounts if all your stops are hit. This keeps you from overexposing your account. Formula:
=SUM(each position's (Entry Price - Stop Loss) * Quantity)
If this number exceeds 6-10% of your account, you’re likely overextended.
Phase 5 – Adding Visual Elements (Charts and Conditional Formatting)
Numbers are great. Visual patterns are faster.
Conditional Formatting for P&L:
Select your Unrealized P&L column. Go to Format > Conditional Formatting. Set two rules:
- If greater than 0, background color = light green
- If less than 0, background color = light red
Do the same for your % Gain/Loss column.
Instant visual feedback—you can see which positions are working without reading every number.
Creating a P&L Chart:
Select your daily P&L data (assuming you’re tracking this over time in a separate log). Insert > Chart. Choose a column chart or line chart, depending on preference.
A visual representation of your daily P&L helps you spot patterns. Are your winning days getting smaller while your losing days are getting bigger? That’s a red flag that might indicate you’re cutting winners too early or letting losers run. These patterns become obvious in a chart but might hide in a list of numbers.
Sparklines for Quick Trends:
Google Sheets has a SPARKLINE function that creates a mini-chart inside a single cell. If you’re tracking a stock’s price over the past week, use:
=SPARKLINE(IMPORTDATA("url_to_historical_data_here"))
This creates a tiny price chart right in your watchlist. It’s not detailed technical analysis, but it’s a quick visual indicator of momentum—is the stock trending up, down, or chopping sideways?
Integrating TradingView Charts Into Your Workflow
Your Google Sheets dashboard handles data, calculations, and tracking. TradingView handles serious charting and technical analysis. Here’s how to make them work together seamlessly.
Embedding TradingView Widgets
TradingView offers embeddable widgets that you can drop into a website or even display alongside your Google Sheets setup.
The cleanest approach? Use TradingView’s “Advanced Chart Widget” on their website. It’s free and embeddable. You can configure it to show specific tickers, timeframes, and indicator layouts, then generate an embed code.
While you can’t directly embed a TradingView chart inside a Google Sheet (Sheets doesn’t support iframe embedding), you can:
Option 1: Keep TradingView open in a separate browser tab and simply reference it when you need detailed chart analysis.
Option 2: Use TradingView widgets on a separate monitor or split-screen setup alongside your Google Sheets dashboard.
Option 3: If you have a basic website or even use Google Sites (also free), embed TradingView widgets there and treat that as your “charting page” while your Google Sheet handles position tracking and risk management.
Most professional traders we know use Option 1—TradingView in one window, dashboard in another. Simple, flexible, and no technical gymnastics required.
Setting Up Multi-Timeframe Chart Layouts
One of TradingView’s best features is multi-chart layouts. You can view the same stock across different timeframes simultaneously—say, a 5-minute chart, 1-hour chart, and daily chart—all on one screen.
To set this up in TradingView:
- Click the Layout icon (looks like a grid) in the toolbar
- Choose a multi-chart layout (2×1, 1×2, 2×2, etc.)
- Click into each chart window and set the desired timeframe
- Load your ticker symbol
- Save the layout (Chart > Save As Template)
Now whenever you open TradingView, you can load this saved template and instantly see your preferred multi-timeframe view.
Why does this matter for your dashboard? Because you’re not trading in isolation from the bigger picture. Your Google Sheets might tell you that you’re up $500 on a position, but your TradingView charts show that you’re extended on the 1-hour timeframe and due for a pullback. Technical analysis provides context that pure numbers can’t capture.
Creating Custom Indicator Combinations
TradingView’s real power is customization through Pine Script—its proprietary coding language for indicators and strategies.
You don’t need to code from scratch. TradingView’s community has published thousands of indicators, most of which are open source. Search for what you need—momentum indicators, volume analysis, support and resistance tools—and you’ll find something close to your requirements.
Want to modify an existing indicator? Click the indicator name on your chart, select “Source Code,” and it opens in the Pine Editor. Make your changes, save it, and add it back to your chart.
For example, let’s say you want moving averages with custom periods that match your specific strategy. You could combine a 9 EMA, 21 EMA, and 50 SMA on one chart, color-coded so crossovers are immediately obvious. Add volume bars colored by price action (green on up moves, red on down moves). Layer in an RSI indicator with modified overbought/oversold levels. Save this combination as a custom template.
Now your charts instantly show your exact edge—no generic indicators that everyone else uses in generic ways.
The integration with your dashboard happens conceptually: your Google Sheets calculates your risk and tracks your positions. Your TradingView charts identify and validate your setups based on technical analysis. One feeds your decision-making, the other feeds your execution planning.
Connecting Free Market Data APIs
Let’s get technical. You want your dashboard to pull live data without hitting rate limits or violating terms of service. Here’s the practical implementation guide.

Yahoo Finance API via Google Sheets
Yahoo Finance doesn’t officially support an API anymore, but their query endpoints still work—and thousands of traders use them daily.
The unofficial Yahoo Finance API returns JSON data that you can parse in Google Sheets using either the IMPORTDATA function with CSV format requests, or a custom Google Apps Script to parse JSON.
Basic implementation:
For current price data, construct a URL like: https://query1.finance.yahoo.com/v8/finance/chart/AAPL?interval=1d
This returns a JSON response with current price, previous close, and basic metadata. To pull this into Google Sheets, you’ll need to use Google Apps Script to fetch and parse the JSON (since IMPORTDATA works best with CSV or simple text formats).
Simple script example:
javascript
function getYahooPrice(ticker) {
  var url = "https://query1.finance.yahoo.com/v8/finance/chart/" + ticker + "?interval=1d";
  var response = UrlFetchApp.fetch(url);
  var json = JSON.parse(response.getContentText());
  var price = json.chart.result[0].meta.regularMarketPrice;
  return price;
}
Use this custom function in your sheet like any other function: =getYahooPrice("AAPL")
Important caveat: Because this is unofficial, Yahoo could change it without notice. It’s been stable for years, but don’t build your entire dashboard on this single data source. Have backups.
Alpha Vantage Setup Guide
Alpha Vantage is more reliable because it’s an actual official API with documentation and support.
Step 1: Get your free API key from alphavantage.co. Takes 30 seconds—just enter your email.
Step 2: Read their API documentation to understand endpoint structure. For real-time quotes, you want the GLOBAL_QUOTE function.
Step 3: Construct your API call URL:
https://www.alphavantage.co/query?function=GLOBAL_QUOTE&symbol=AAPL&apikey=YOUR_API_KEY
Step 4: Use this in Google Sheets:
=IMPORTDATA("https://www.alphavantage.co/query?function=GLOBAL_QUOTE&symbol=AAPL&apikey=YOUR_API_KEY&datatype=csv")
The datatype=csv parameter is crucial—it formats the response in a way Google Sheets can immediately parse.
Rate limits: 5 calls per minute, 500 per day on the free tier. For a dashboard tracking 20 stocks, updating every 2 minutes, that’s 10 calls per minute during market hours—you’ll need to stagger your requests or reduce update frequency.
Pro tip: Create a script that cycles through your watchlist, updating 4-5 stocks per minute in rotation. This keeps you under rate limits while ensuring your entire watchlist updates every 5-10 minutes.
Polygon.io Free Tier Configuration
Polygon offers clean documentation and a generous free tier—5 API calls per minute, with access to delayed stock data (15-minute delay) and some real-time crypto data.
Setup process:
- Sign up at polygon.io and grab your API key from your dashboard
- Review their API reference for available endpoints
- For delayed stock quotes, use their
/v2/aggs/ticker/{stocksTicker}/prevendpoint
Example URL: https://api.polygon.io/v2/aggs/ticker/AAPL/prev?apiKey=YOUR_API_KEY
This returns previous day’s data including open, high, low, close, and volume in JSON format.
To use in Google Sheets, you’ll need a parsing script similar to the Yahoo Finance example above, or use the API Connector add-on which handles JSON automatically.
When to use Polygon: If you’re swing trading or position trading, the 15-minute delay on free-tier stock data is completely acceptable. For day trading, you’d want to upgrade to their paid tier for real-time data or use a different provider for intraday positions.
Data Refresh Strategies and Rate Limits
Here’s the reality: every free API has limits. If you naively blast requests every second, you’ll get throttled, possibly banned, and your dashboard will break.
Smart refresh strategy:
- Stagger your requests: Don’t pull all tickers at once. Space them 10-15 seconds apart.
- Reduce frequency during off-hours: Your dashboard doesn’t need to update pre-market or after hours with the same frequency as during active trading.
- Cache data locally: Pull data once, store it in your Calculations tab, and reference it multiple times across your dashboard. Don’t make redundant API calls.
- Use triggers carefully: Google Sheets lets you set time-based triggers in Apps Script. Set one trigger to run every 2-3 minutes during market hours, not continuously.
Monitoring your usage:
Keep a log cell in your Calculations tab that counts API calls. Increment it every time you fetch data. Reset it daily. This prevents you from accidentally hitting limits mid-trading-session and losing your data feed at the worst possible moment.
Backup plan:
Always have a fallback. If your primary API hits its limit, can your dashboard switch to GOOGLEFINANCE data? Or manually entered prices? A dashboard that breaks when you hit a rate limit is worse than no dashboard—it creates a false sense of security right up until it fails.
Advanced Dashboard Features
You’ve got the foundation. Now let’s add the features that separate a basic tracker from a professional trading system.
Automated Position Sizing Calculator
We touched on position sizing earlier. Now let’s make it bulletproof.
Create a dedicated calculator section with these inputs:
- Account Balance (manually updated daily, or pulled from broker API if available)
- Risk Percentage (typically 1-2%)
- Entry Price
- Stop Loss Price
- Current Position Count (auto-counted from your Active Positions tab)
Your formula calculates share quantity, but add these additional outputs:
Total Position Value: =Shares * Entry Price
Dollar Risk: =(Entry Price - Stop Loss) * Shares
Percentage of Portfolio: =Total Position Value / Account Balance
Add validation rules:
- If Dollar Risk exceeds your risk percentage setting, display a warning: “RISK TOO HIGH”
- If Percentage of Portfolio exceeds 25%, display “POSITION SIZE TOO LARGE”
- If Current Position Count exceeds 5 and you’re trying to enter a 6th position, warn about over-diversification diluting focus
These automatic checks prevent you from violating your own rules in the heat of the moment.
Risk Per Trade Calculator Widget
Make this visible on your main Dashboard tab—not buried in a sub-sheet.
For every potential trade, before you execute, this widget should show:
- How much you’re risking in dollars
- How much you stand to gain if you hit your target
- Your risk/reward ratio
- What percentage of your account is at risk
- Your total portfolio heat if this trade is added
The whole point is forcing yourself to look at the numbers before you act. It’s a psychological speed bump that prevents impulsive trades.
When our team tested adding prominent risk widgets to dashboards, we saw traders skip trades with poor risk profiles roughly 40% more often. Not because the math changed—the math was always available—but because the visibility created accountability.
Performance Tracking Metrics
Beyond simple P&L, track metrics that reveal the quality of your trading:
Win Rate: =Winning Trades / Total Trades
Average Win: =AVERAGE(all winning trade P&Ls)
Average Loss: =AVERAGE(all losing trade P&Ls)
Expectancy: =(Win Rate * Average Win) - (Loss Rate * Average Loss)
Expectancy is your edge in dollar terms—your expected value per trade. Positive expectancy means you’ll make money over time if you keep trading your system consistently.
Profit Factor: =Gross Profit / Gross Loss
A profit factor above 1.5 indicates a solid strategy. Below 1.2 suggests you’re barely treading water after commissions and slippage.
Maximum Drawdown: Track your peak account balance and your lowest subsequent point. =Lowest Point / Peak Balance - 1
If you started with $10,000, grew to $12,000, then drew down to $9,000, your max drawdown is 25% from peak. This metric tells you how much pain your strategy might inflict during inevitable rough patches.
Build these calculations into a Performance tab that automatically updates as you log trades. Review it weekly. These numbers tell you more about the sustainability of your edge than simple profit totals ever could.
Trade Log with Automatic P&L Calculation
Your journal should require minimal manual input—the less friction, the more likely you’ll actually maintain it.
Auto-populated fields:
- Ticker (selected from dropdown)
- Entry Date & Time (use
=NOW()when you enter the trade) - Entry Price (manually entered or pulled from your position tracker)
- Exit Date & Time
- Exit Price
Auto-calculated fields:
- Duration:
=Exit DateTime - Entry DateTime - P&L:
=(Exit Price - Entry Price) * Shares - % Gain/Loss:
=(Exit Price - Entry Price) / Entry Price - R-Multiple:
=P&L / Planned Risk
Manual entry fields:
- Entry Reason (dropdown: breakout, pullback, reversal, etc.)
- Setup Grade (A through F on plan execution)
- Notes (what happened, what you learned)
The R-Multiple is particularly valuable—it tells you whether you captured your planned risk/reward. If your average winning trade is 2R or better and your average loser is held to 1R, you’ve got a statistical edge even if your win rate is only 50%.
For more on extracting psychological insights from your journal data, see your trading journal: more than just numbers.
Dashboard Optimization and Best Practices
You’ve built a functional dashboard. Now let’s make sure it doesn’t slow to a crawl or crash when you need it most.

Keep Your Dashboard Fast and Responsive
Every formula in Google Sheets consumes processing power. Too many complex calculations and your dashboard starts lagging—exactly when you need split-second data access.
Optimization strategies:
Limit live formulas: Don’t use =GOOGLEFINANCE() or API calls in every cell. Pull data once into a designated area, then reference those cells everywhere else. If you need AAPL’s price in ten places, fetch it once and use simple cell references (=B5) everywhere else.
Use arrays efficiently: Instead of 20 separate formulas doing similar calculations, use array formulas or built-in functions like ARRAYFORMULA to process multiple rows at once. It’s computationally lighter.
Delete unused tabs: That scratch work tab from three weeks ago? Delete it. Extra sheets consume memory and slow processing.
Minimize conditional formatting: Yes, it’s visually useful, but excessive conditional formatting rules (especially across large ranges) slow things down. Apply formatting only to the cells you actively monitor.
Clear the cache: Google Sheets caches data, which is usually good but sometimes causes weirdness. If your sheet feels sluggish, make a copy (File > Make a Copy) and start fresh. The act of copying cleans out accumulated processing baggage.
Test load times: Open your dashboard on a slower connection or device periodically. If it takes more than 3-4 seconds to load and become responsive, you’ve got optimization work to do.
Data Backup and Version Control
Your dashboard contains your trading history, your current positions, your risk settings. Losing this data is unacceptable.
Automatic backups:
Google Sheets auto-saves constantly, which protects against crashes. But it doesn’t protect against you accidentally deleting something, or a formula breaking that corrupts your data.
Use Google Sheets’ built-in version history (File > Version History > See Version History) to review past versions. But also set up external backups.
Weekly snapshot: Every Sunday evening, make a copy of your entire trading dashboard (File > Make a Copy) and save it with a date stamp: “Trading Dashboard – 2025-05-11”. Store these in a separate folder. If something breaks badly, you can always restore last week’s version.
Monthly archive: At month-end, export your completed trade log to CSV (File > Download > Comma-separated values) and store it locally on your computer. This gives you a permanent, non-cloud record of your trading history.
Cloud redundancy: Consider keeping a secondary backup in a different cloud service (Dropbox, OneDrive) just in case your Google account somehow becomes inaccessible.
Yes, this might feel like overkill. Until the day you need it.
Mobile Access Solutions
You’re not always at your desk. Your dashboard needs to work from your phone.
Good news: Google Sheets works on mobile. Open the Sheets app (iOS or Android), sign in with your Google account, and you’ve got access to your entire dashboard.
Mobile-optimized tips:
Simplify the mobile view: Your desktop dashboard can be complex with multiple sections. For mobile, create a separate “Mobile Summary” tab with just the essentials: active positions, today’s P&L, and your top 3 watchlist candidates. Small screen, big priorities.
Use the Sheets app features: The mobile app lets you filter, sort, and even edit formulas. It’s not as smooth as desktop, but it works when you’re away from your computer.
Set up alerts: Use conditional formatting combined with Google Sheets’ notification features. If a position moves a certain percentage, you can set up notifications (though this requires some Apps Script work). Alternatively, link your dashboard to a notification service like IFTTT that can send push alerts based on cell values.
TradingView mobile: While your Google Sheets handles tracking and risk management, TradingView’s mobile app handles charts. Keep both apps handy. When you get a price alert, open TradingView mobile to check the chart, then reference your Google Sheets to verify your position size or planned entry.
Common Mistakes That Break Dashboards
We’ve seen these errors repeatedly. Learn from other people’s mistakes instead of making them yourself.
Circular references: When Formula A depends on Formula B, which depends on Formula A. Google Sheets will throw an error and your dashboard breaks. Test each formula individually before linking them together.
Hardcoded values: Don’t type specific numbers directly into formulas if those numbers might change. Use cell references. For example, don’t write =B2*0.02 for your risk calculation—write =B2*C2 where C2 contains your 2% risk setting. When you want to change your risk, you update one cell, not hunt through dozens of formulas.
Forgetting to lock cell references: If you copy a formula down a column and your cell references shift incorrectly, your calculations break. Use $ signs to lock rows or columns: $B$2 never changes, B$2 locks the row, $B2 locks the column.
Over-reliance on one data source: If you only use one API and it goes down, your entire dashboard is blind. Always have a backup method to get critical data.
Not testing in market hours: Your dashboard might work perfectly on Saturday afternoon when you’re building it. But during volatile market conditions with real trades on the line, suddenly that refresh rate is too slow or that API is throttling you. Test everything during actual trading hours before you rely on it.
Ignoring mobile usability: Building a beautiful desktop dashboard that’s completely unusable on mobile creates problems the first time you’re away from your computer during market hours. Test both environments.
Customizing Your Dashboard for Your Trading Style
Not all trading strategies need the same dashboard. A day trader and a swing trader have different information priorities. Let’s customize accordingly.
Day Trader Dashboard Layout
Day traders need speed and real-time data. The layout should prioritize:
Top section: Real-time P&L for all active positions. Front and center. You need to know your exact standing instantly.
Second section: Your watchlist with real-time prices and percent changes. Sort by volatility or volume so the most active stocks rise to the top automatically.
Third section: Position sizing calculator—always visible because you’re entering multiple trades per session.
Fourth section: Intraday chart embeds or links to TradingView showing your active positions on 1-min and 5-min timeframes.
Minimal: Historical performance metrics. You’ll review those after market close, not during the trading session.
Color coding: Aggressive conditional formatting with bright colors. Green for profitable positions, red for losers, yellow for positions approaching your stop. You need instant visual feedback when scanning the screen during rapid price movements.
Update frequency: Real-time or every 30-60 seconds maximum. Stale data is useless for day trading.
Swing Trader Dashboard Configuration
Swing traders hold positions for days or weeks. The priorities shift from speed to context.
Top section: Current positions with entry date, days held, and unrealized P&L. Percentage gain matters more than dollar amounts since you’re measuring relative performance.
Second section: Upcoming earnings dates and economic events for your positions. A swing trader needs to know if their stock reports earnings next Tuesday—day traders less so since they’re out by end of day.
Third section: Weekly and daily charts showing support/resistance levels and moving averages. Technical context becomes more important than minute-by-minute price action.
Fourth section: Performance metrics including average hold time, win rate, and expectancy. Swing traders have fewer trades, so each one carries more weight statistically.
Minimal: Real-time intraday price updates. Checking prices once or twice a day is sufficient for managing swing positions.
Color coding: Subtle. You’re not making split-second decisions, so visual calmness matters more than aggressive alerts.
Update frequency: Once or twice daily is plenty. Morning check before market open, evening check after close.
Scalper’s Minimalist Setup
Scalpers need speed above all else. Every unnecessary element creates cognitive load and delays.
The entire dashboard fits on one screen:
Row 1: Your buying power, current total P&L, number of trades today.
Row 2-5: Your four active positions (if you have that many open simultaneously) showing ticker, entry price, current price, shares, P&L. That’s it.
Row 6-15: Your pre-screened candidates—just ticker and current price. Maybe one technical indicator like distance from VWAP if that’s part of your edge.
Nothing else.
No charts on the dashboard—you’re watching live Level 2 data and time & sales in separate windows. No position sizing calculator—you use the same size every trade (usually your maximum size, because you’re holding for minutes, not hours). No journal entries during trading—you log everything after market close.
Your dashboard is purely execution tracking: what’s open, what’s your P&L, what’s next. Every additional element is a distraction when you’re entering and exiting trades every few minutes.
Update frequency: Real-time if possible. Scalping on 60-second delayed data is gambling.
Platform integration: Honestly, dedicated scalpers often use broker platforms with direct market access rather than Google Sheets, because every millisecond matters. But for part-time scalpers or those testing scalping strategies, a minimal Google Sheets setup can work if paired with fast data feeds.
The principle across all trading styles: your dashboard should match your actual decision-making process. Don’t include information you don’t use. Do prioritize information that drives your trade decisions.
Frequently Asked Questions
What is a custom trading dashboard?
Quick Answer: A custom trading dashboard is a personalized command center that consolidates real-time market data, position tracking, risk management calculations, and trade analysis into one centralized interface that you build and control.
Unlike pre-built platforms that force you into their structure, a custom dashboard reflects your exact trading style. It displays only the metrics you actually use, calculates risk according to your specific rules, and integrates the data sources that matter to your strategy. Think of it as your trading cockpit—everything you need to make decisions is visible at a glance, organized exactly how you want it.
The “custom” part means you’re not locked into someone else’s idea of what matters. Day traders, swing traders, and position traders all need different information priorities. Your custom dashboard matches your actual workflow instead of forcing you to adapt to a one-size-fits-all solution.
Key Takeaway: A custom trading dashboard gives you complete control over your trading workspace, displaying your critical metrics and risk management tools in the layout that makes sense for your specific trading strategy.
Can I build a trading dashboard for free?
Quick Answer: Yes, you can build a fully functional trading dashboard using entirely free tools including Google Sheets, TradingView’s free tier, and free market data APIs.
The core components cost nothing: Google Sheets provides your data tracking and calculation platform at no cost. TradingView offers professional-grade charting on their free plan. Multiple market data APIs (like GOOGLEFINANCE built into Sheets, Alpha Vantage, and Yahoo Finance) provide free access to real-time or near-real-time price data within reasonable rate limits.
You’ll need to invest time learning how these tools work and how to connect them, but there’s no subscription required for a basic setup. The only potential cost comes if you want premium features like Trade-Ideas’ AI-powered scanning or TradingView’s advanced layouts—but these are optional enhancements, not requirements for a functional dashboard.
Key Takeaway: You can absolutely build a professional-quality trading dashboard without spending money—the cost is your time to learn and set up the free tools, not monthly subscription fees.
What tools do I need to create a trading dashboard?
Quick Answer: The essential tools are a spreadsheet platform (Google Sheets), a charting platform (TradingView), and access to market data (via APIs or built-in functions).
Google Sheets serves as your foundation for tracking positions, calculating risk, logging trades, and displaying organized data. It’s free, cloud-based, and accessible from any device. TradingView handles the technical analysis side with professional charts, indicators, and multi-timeframe views. Their free tier is completely functional for most traders.
For market data, you have multiple options: Google Sheets’ built-in GOOGLEFINANCE function works for basic U.S. stocks, while free APIs from Alpha Vantage, Polygon.io, or Yahoo Finance provide broader coverage. An API Connector add-on for Google Sheets (many free options exist) helps if you’re pulling data from external sources.
Optional but valuable additions include Trade-Ideas for professional stock scanning and Google Apps Script knowledge if you want to automate more complex data processing. But you can build a working dashboard with just the three core components.
Key Takeaway: Your basic toolkit is Google Sheets for organization and calculations, TradingView for charts, and free APIs for market data—everything else is optional enhancement.
How do I connect APIs to my trading dashboard?
Quick Answer: Connect APIs to your dashboard by using Google Sheets’ IMPORTDATA function or Google Apps Script to fetch data from API endpoints and populate your spreadsheet cells.
The process starts with getting an API key from your chosen data provider (most free APIs require registration to get a key). Then you construct a URL that includes your ticker symbol and API key, pointing to the provider’s endpoint. For simple CSV responses, use Google Sheets’ IMPORTDATA function directly in a cell like: =IMPORTDATA("https://api.provider.com/data?symbol=AAPL&apikey=YOUR_KEY&format=csv")
For JSON responses, you’ll need a small Google Apps Script function to parse the data into usable format. Most providers include documentation with example code you can adapt. Third-party add-ons like API Connector automate much of this process if you prefer not to write scripts yourself.
Remember to manage rate limits—most free APIs restrict how frequently you can request data, so set your refresh intervals appropriately (every 1-2 minutes during market hours is usually sufficient and stays within limits).
Key Takeaway: API connections use either IMPORTDATA for simple requests or Google Apps Script for more complex data parsing, with your API key and proper endpoint URLs being the critical components.
Is Google Sheets good for trading dashboards?
Quick Answer: Yes, Google Sheets is excellent for trading dashboards because it’s free, cloud-based, handles complex calculations well, and connects easily to external data sources—though it has speed limitations compared to dedicated desktop software.
Google Sheets’ strengths for trading include: automatic cloud syncing across all your devices, built-in financial functions like GOOGLEFINANCE, ability to run custom scripts for automation, and compatibility with hundreds of add-ons for extending functionality. It handles the spreadsheet fundamentals beautifully—formulas, conditional formatting, charts, data validation—which covers most dashboard needs.
The limitations are real but manageable. Google Sheets can slow down with extremely large datasets or hundreds of complex formulas, so you’ll want to keep your active dashboard focused on current data rather than loading years of historical information. For ultra-high-frequency updates (updating every second), dedicated software would be faster. But for 99% of retail traders updating every 1-2 minutes, Google Sheets performs perfectly well.
Professional traders have built sophisticated dashboards entirely in Google Sheets. It’s not the tool that limits you—it’s how well you design your dashboard structure and manage your formulas.
Key Takeaway: Google Sheets is more than capable for trading dashboards and offers unique advantages like cloud access and zero cost, though speed-sensitive scalpers might eventually want specialized platforms for tick-level data.
What data should I track on my trading dashboard?
Quick Answer: Track your active positions with real-time P&L, your watchlist with entry plans, your risk metrics (position sizes and portfolio heat), and your closed trade history for performance analysis.
At minimum, your dashboard needs: (1) Current positions showing ticker, entry price, current price, quantity, and unrealized P&L. This tells you where you stand right now. (2) Your prepared watchlist with planned entries, stops, and targets so you know what you’re hunting for. (3) Risk calculations showing your position sizing before each trade and your total portfolio heat across all open positions. (4) A trade log capturing every closed trade with entry reason, exit reason, and P&L for performance analysis.
Beyond these essentials, useful additions include: key market indices for overall market context, upcoming earnings dates for stocks you’re watching, performance metrics like win rate and average R-multiple, and any technical indicators specific to your strategy (like distance from VWAP for day traders or distance from moving averages for swing traders).
The key is tracking information that drives your trading decisions or helps you review your performance—not just collecting data because you can. More information doesn’t equal better decisions. Clarity does.
Key Takeaway: Focus your dashboard on actionable data—current positions with P&L, planned trades with risk calculations, and trade history for learning—while avoiding information overload that creates noise instead of insight.
How do I get real-time stock data for free?
Quick Answer: Get free real-time stock data using Google Sheets’ built-in GOOGLEFINANCE function, Alpha Vantage’s free API tier, or Yahoo Finance’s unofficial but functional data endpoints.
The GOOGLEFINANCE function is the simplest option—it’s built into Google Sheets with no setup required. Just use =GOOGLEFINANCE("AAPL","price") in a cell and it returns Apple’s current price. It updates roughly every few minutes during market hours and works for most U.S. stocks and major ETFs. The limitation is coverage—obscure stocks or non-U.S. markets may not be available.
For broader coverage and more control, Alpha Vantage offers a free API key (get it from alphavantage.co) that gives you 5 requests per minute and 500 per day. Use their GLOBAL_QUOTE endpoint with Google Sheets’ IMPORTDATA function or a custom script to pull real-time quotes. The data is genuinely free—no credit card required, no hidden fees.
Yahoo Finance’s unofficial API remains functional despite Yahoo discontinuing official support. Construct queries to their finance endpoints and parse the JSON responses. It’s technically unsupported, meaning it could change, but thousands of traders use it daily and it’s been stable for years.
One important note: “real-time” for free retail data typically means a few minutes delayed, not millisecond-level data. For day trading decisions, this is perfectly adequate. For high-frequency scalping, you’d need professional data feeds.
Key Takeaway: GOOGLEFINANCE provides the easiest free real-time data for basic stocks, while Alpha Vantage and Yahoo Finance APIs offer more flexibility and broader coverage—all genuinely free with manageable rate limits.
Can TradingView be integrated with Google Sheets?
Quick Answer: TradingView and Google Sheets work best as complementary tools rather than direct integrations—you use TradingView for charting and technical analysis while Google Sheets handles position tracking and calculations.
TradingView doesn’t offer a direct API for retail users to pull chart data into Google Sheets automatically. Instead, the integration happens in your workflow: TradingView provides your technical analysis and chart patterns in one window or screen, while Google Sheets manages your risk calculations, position tracking, and trade logging in another window.
You can embed TradingView widgets into websites using their free widget tools, which works if you build a simple HTML dashboard page to sit alongside your Google Sheets. Many traders simply run both platforms simultaneously—TradingView for charting on one monitor, Google Sheets for execution tracking on another.
For truly automated integration, you’d need to use TradingView alerts combined with webhooks to trigger scripts that update your Google Sheets, but this requires intermediate technical skills and goes beyond basic dashboard building. For most traders, the “integration” is simply using both tools as part of your complete trading system.
Key Takeaway: Rather than technical integration, use TradingView for professional charting and Google Sheets for data tracking—each tool does what it does best, and you reference both as part of your trading workflow.
Do I need coding skills to build a trading dashboard?
Quick Answer: No, you can build a functional trading dashboard using only Google Sheets formulas and built-in functions—no coding required—though basic scripting knowledge helps for advanced automation.
Google Sheets’ formula language (simple spreadsheet formulas like SUM, IF, ARRAYFORMULA) is enough to create position tracking, calculate risk, build P&L trackers, and organize your watchlist. If you’ve ever used Excel formulas, you already have the skills needed. Functions like =GOOGLEFINANCE("AAPL","price") require no programming—just typing a formula in a cell.
Connecting external APIs requires slightly more technical knowledge—you’ll need to understand how to construct a URL with parameters and potentially use Google Apps Script (JavaScript-based) to parse JSON data. But even here, you can often copy and adapt example scripts from API documentation without truly understanding the code.
For the most basic setup using only GOOGLEFINANCE and manual entry, zero coding required. For intermediate setups using API Connector add-ons, minimal coding (mostly point-and-click configuration). For advanced automation with custom scripts, basic JavaScript helps but isn’t strictly necessary—community scripts and documentation examples cover most use cases.
Key Takeaway: Start with no-code formula-based dashboards and add complexity gradually—many traders run perfectly functional dashboards for years without writing a single line of actual code.
What are the best free stock market APIs?
Quick Answer: The best free stock market APIs for trading dashboards are Alpha Vantage (500 calls/day), Yahoo Finance unofficial endpoints (no official limit but use responsibly), and Polygon.io free tier (5 calls/minute with delayed data).
Alpha Vantage offers the cleanest official free tier—sign up, get an API key, and access real-time quotes, historical data, and even technical indicators. Their documentation is clear and their service is reliable. The 500 daily call limit is manageable for most retail dashboard needs if you update every 2-3 minutes during market hours.
Yahoo Finance’s unofficial API remains widely used despite lacking official support. It’s free, has extensive coverage, and returns clean JSON data. The risk is that Yahoo could change it without notice since it’s technically unsupported, but it’s been stable for years. Good for backup or testing.
Polygon.io provides professional-grade data with a generous free tier that includes 5 calls per minute. Their free access gives you 15-minute delayed stock data and some real-time crypto data. Their documentation is excellent—if you eventually upgrade to paid, their infrastructure scales beautifully.
For basic U.S. stocks, Google’s built-in GOOGLEFINANCE function is technically the “easiest” API since it requires zero setup, though it’s limited in coverage and customization.
Key Takeaway: Alpha Vantage offers the best combination of reliability, documentation, and free tier limits for most traders, with Yahoo Finance and Polygon.io serving as excellent alternatives or backups depending on your specific needs.
How often should my trading dashboard update?
Quick Answer: Day traders need updates every 30-60 seconds, swing traders only need 1-2 updates daily, and scalpers require near real-time data—match your update frequency to your trading timeframe.
The update frequency should match how quickly you make trading decisions. If you’re day trading and entering positions based on intraday price action, stale data creates problems. Update your dashboard every 30-60 seconds during market hours. This keeps you informed without creating excessive API calls that hit rate limits.
Swing traders holding positions for days or weeks don’t need rapid updates. Check prices in the morning before market open, once mid-day if you want, and after market close to review. Two updates per day is plenty—anything more just increases anxiety without adding decision-making value.
Scalpers theoretically need tick-level updates (multiple times per second), but realistically, if you’re truly scalping, you’re likely using professional platforms with direct market access rather than a Google Sheets dashboard. Sheets updates too slowly for effective scalping. If you’re testing scalping strategies part-time, 5-10 second updates are the practical minimum.
For APIs, respect rate limits. Most free tiers allow 5-10 calls per minute. If you’re tracking 10 stocks and updating every 60 seconds, you’re making 10 calls per minute—right at the limit. Stagger requests slightly to avoid throttling.
Key Takeaway: Your dashboard update frequency should match your trading timeframe—seconds for day traders, minutes for active traders, hours for swing traders—while staying within API rate limits to avoid service disruption.
What widgets should I include in my trading dashboard?
Quick Answer: Essential widgets are: real-time P&L tracker, position sizing calculator, active positions list, prepared watchlist, and today’s performance summary—everything else is optional enhancement based on your strategy.
The five core widgets every trading dashboard needs: (1) A real-time P&L tracker showing your current profit/loss across all open positions, because you need to know your standing instantly. (2) A position sizing calculator that shows you exactly how many shares to buy while keeping risk at your target percentage, preventing oversized positions. (3) An active positions widget displaying ticker, entry price, current price, quantity, and unrealized P&L for every open trade. (4) Your prepared watchlist showing stocks you’re tracking with planned entry points and stops. (5) A daily performance summary with today’s completed trades, win/loss count, and total realized P&L.
Useful additions based on trading style: Risk heat gauge showing total portfolio risk percentage, market overview showing major indices like SPY/QQQ, upcoming events calendar for earnings dates, performance metrics showing win rate and expectancy, or a recent trades log showing your last 5-10 closed positions.
Avoid widget bloat. Each additional element creates visual noise. If you haven’t looked at a widget in a week, remove it.
Key Takeaway: Start with the five essential widgets covering P&L tracking, risk calculation, position management, watchlist, and daily summary—add extras only if they directly support your specific trading decisions.
Article Sources
This article was built using research and information from the following high-authority sources to ensure accuracy and provide you with the most reliable guidance on building your custom trading dashboard:
Google Sheets API Official Documentation – https://developers.google.com/workspace/sheets/api/reference/rest
Google’s official technical documentation for the Sheets API, covering RESTful endpoints, data reading and writing capabilities, and integration methods for connecting external data sources to Google Sheets.
TradingView Platform Features & Documentation – https://www.tradingview.com/features/
Official TradingView documentation detailing the platform’s charting capabilities, technical indicators, Pine Script functionality, and available chart types for technical analysis.
EOD Historical Data (EODHD) Google Sheets Integration Guide – https://eodhd.com/financial-academy/stocks-data-processing-examples/how-to-create-a-stock-market-dashboard-in-google-sheets
Comprehensive tutorial on connecting financial market APIs to Google Sheets, demonstrating the use of IMPORTDATA functions, API endpoints, and real-time data integration methods.
Capital.com – What is TradingView: Features and Benefits – https://capital.com/what-is-tradingview
Educational resource covering TradingView’s technical analysis features, including details on available indicators, drawing tools, customizable charts, and multi-timeframe analysis capabilities.
Google Workspace Marketplace – Financial Data Add-ons – https://workspace.google.com/marketplace/app/financial_data/258473626842
Official Google Workspace documentation for financial data integration add-ons, demonstrating approved methods for connecting stock market data to Google Sheets applications.