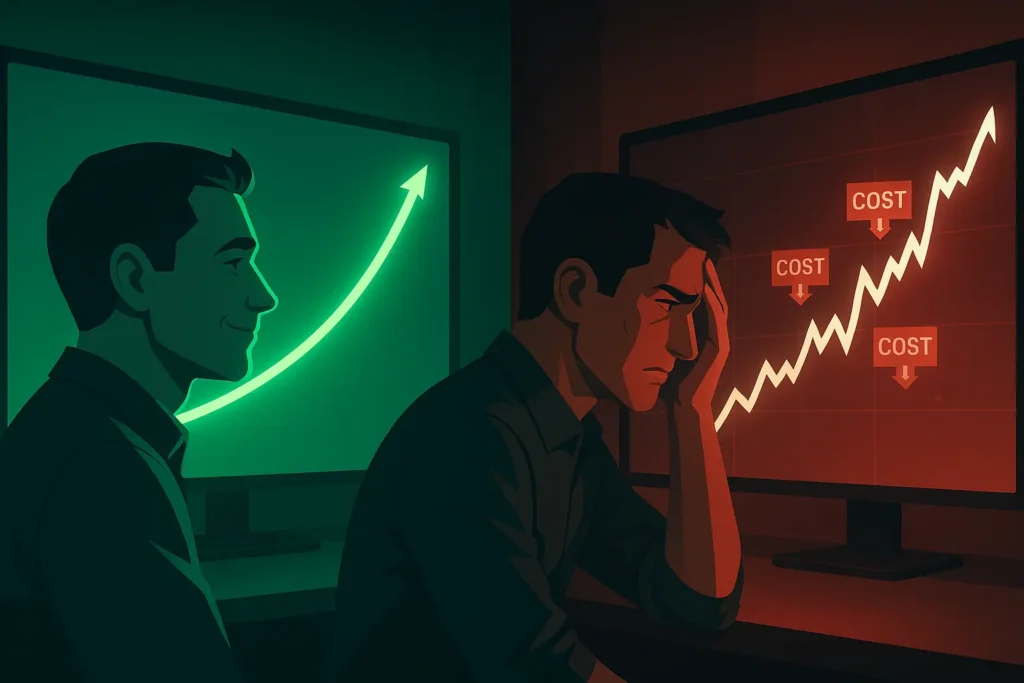
Here’s a story our team has seen play out dozens of times. A trader discovers a new strategy, spends weeks meticulously backtesting it, and the results are phenomenal—a beautiful, upward-sloping equity curve. They eagerly build a bot, deploy it with real capital, and then… reality hits. The live performance is flat, choppy, or even negative. The magic is gone.
This frustrating experience is caused by “The Performance Gap”—the often-massive difference between a sterile, perfect-world backtest and the messy, friction-filled reality of live trading.
This guide will expose the four major categories of automated trading costs that create this gap. Understanding these bot trading expenses is the crucial, often-overlooked step that separates profitable automated traders from frustrated ones.
The Performance Gap: Why Backtests Don’t Match Reality
A backtest is a simulation run under laboratory conditions. It assumes you get filled instantly at the exact price your signal triggered, with zero delays or unexpected fees. Live trading, however, is a full-contact sport filled with “friction.” This friction is a collection of small, often invisible costs that collectively kill performance.
This is the critical step that comes after you’ve learned how to backtest a trading strategy. You have your potential performance; now it’s time to understand the real-world deductions.
Cost Category 1: Explicit Algo Trading Fees
These are the most obvious costs. They appear on your brokerage statement, but many traders underestimate their cumulative impact, especially on higher-frequency bots.
Commissions & Per-Share Fees
This is the standard fee your broker charges for the service of executing your trade. It might be a flat rate (e.g., $0.50 per trade) or a per-share model (e.g., $0.005 per share). For a bot that trades 50 times a day, these fees add up incredibly fast.
Exchange & Regulatory Fees
These are tiny fees charged by exchanges and regulators (like the SEC and FINRA) on transactions, which your broker passes on to you. While minuscule on a single trade, they can become a noticeable expense over thousands of executions.
The Bid-Ask Spread
This is the most common “invisible” fee. The spread is the tiny difference between the highest price a buyer is willing to pay for a stock (the bid) and the lowest price a seller is willing to accept (the ask). When your bot buys at the ask and later sells at the bid, you instantly lose the spread. It’s a guaranteed cost on every single round-trip trade.
For a foundational understanding, review our guide to Understanding Brokerage Costs.
Cost Category 2: Slippage in Automated Trading – The Silent Profit Killer
Slippage is the single most underestimated cost in automated trading.
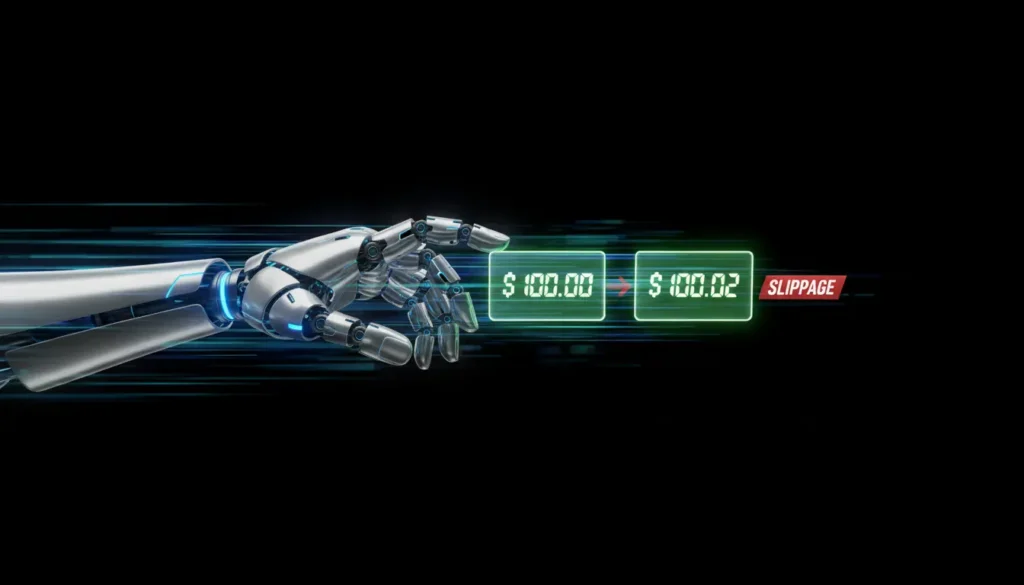
What is Slippage?
Slippage is the difference between the price you expected to get when your signal triggered and the actual price at which your order was filled. If your bot’s signal triggers to buy a stock at $100.00, but by the time the order is executed, the best available price is $100.02, you’ve incurred $0.02 of slippage per share.
The Automation Speed Paradox
Here’s a concept that trips up many new algo traders. You’d think a bot’s speed would reduce slippage. While that can be true for placing limit orders, it can actually increase slippage when using market orders. A bot chasing a fast-moving breakout will send a market order that says, “Get me in at any price, right now!” In a volatile market, “any price” can be significantly worse than where the signal triggered.
Market Impact
This is a more advanced concept but is relevant for any trader using significant size. The very act of your bot executing a large buy or sell order can move the market. If your bot tries to buy 10,000 shares of a stock, it will consume all the available liquidity at the current ask price and have to “pay up” to find more sellers at higher prices, creating its own slippage.
Cost Category 3: Technology & Latency Costs
Running a professional-grade automated system requires professional-grade infrastructure. These are the costs to ensure your bot runs reliably and quickly.
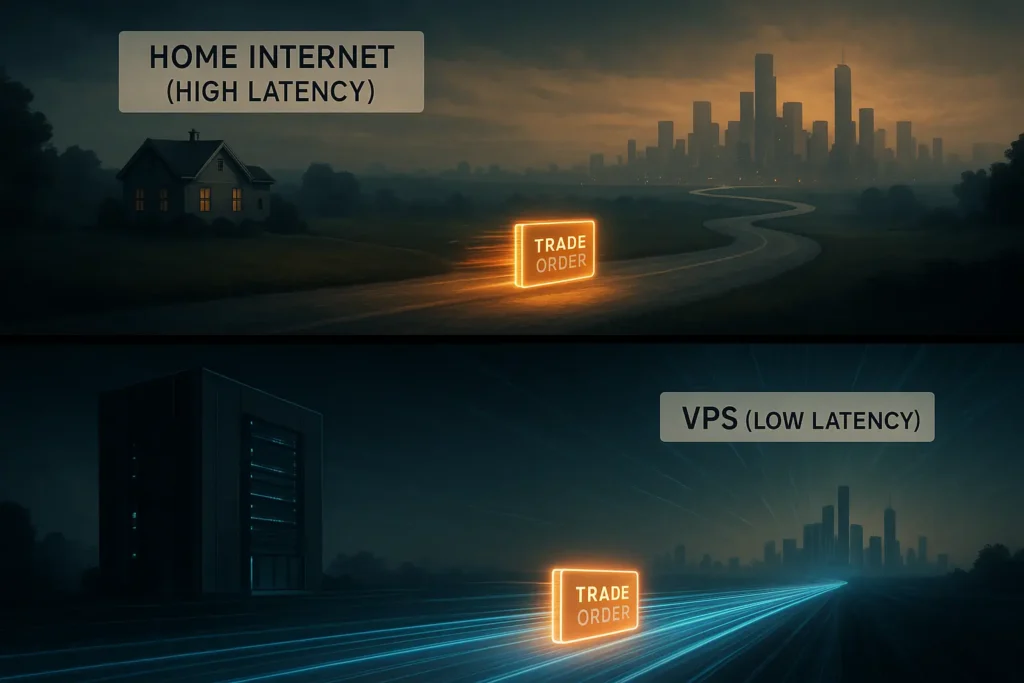
Network Latency
Latency is the physical delay, measured in milliseconds, for your trade signal to travel from your computer to your broker’s server. In a fast-moving market, the price can change meaningfully during that tiny delay, causing slippage.
VPS (Virtual Private Server) Costs
You can’t run a serious trading bot from your home laptop. It needs to run 24/7 on a highly stable, ultra-fast internet connection. A VPS is a remote computer that you rent on a monthly basis from a specialized hosting company to run your trading software. This is a standard monthly expense for most automated traders.
Co-location (For the Pros)
This is the ultimate solution for minimizing latency, but it’s reserved for high-frequency trading firms. Co-location involves paying a premium to rent server space inside the same data center as the stock exchange’s own servers, reducing the travel time for orders to near zero.
Cost Category 4: Platform & Data Subscriptions
The software and information that power your bot are rarely free. These recurring costs must be factored into your profitability.
Platform Fees
This is the monthly or annual subscription cost for the software you use. This could be a no-code platform like Trade Ideas or 3Commas, or a dedicated backtesting and execution software.
Real-Time Data Feeds
Your bot needs clean, reliable, real-time market data to make decisions. The free, delayed data that most platforms offer is not sufficient. Professional-grade, direct-from-exchange data feeds often carry a significant monthly subscription fee.
API Access Fees
While most brokers offer free API access for placing basic orders, some may charge for access to their more advanced, high-speed data feeds or order-routing capabilities through the API.
How to Calculate Your “True Cost Per Trade”
To understand your real profitability, you must think beyond commissions. A simple way to conceptualize this is:
True Cost = Explicit Fees (commissions, etc.) + Implicit Costs (estimated spread + estimated slippage)
For a bot that aims to make only a few cents per share on each trade, this “true cost” calculation is everything. If your true cost is $0.02 per share and your strategy’s average profit is $0.03 per share, you’re profitable. If the reverse is true, you have a losing system, no matter how great the backtest looks.
Strategies to Minimize Your Automated Trading Costs
You can’t eliminate costs, but you can manage them intelligently.
Strategy 1: Lower Your Trading Frequency This is the simplest solution. Every cost we’ve discussed is magnified by frequency. A swing trading bot that places 10 trades a month is far less sensitive to costs than a scalping bot that places 500 trades a day.
Strategy 2: Use Limit Orders A market order says, “Get me in at any price.” A limit order says, “Get me in at this price or better.” Using limit orders is the most effective way to protect yourself from negative slippage, though it comes with the risk that your order may not get filled if the price moves away too quickly.
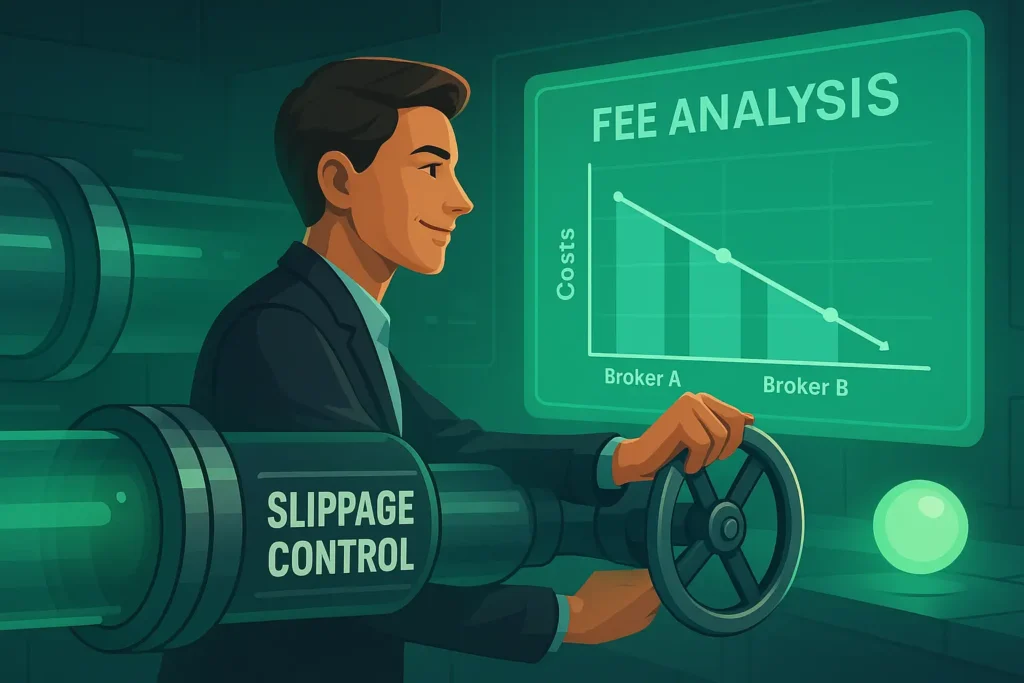
Strategy 3: Analyze Your Broker’s Fee Structure Don’t just choose the broker with the lowest advertised commission. Look at the full picture. Does your strategy benefit more from a flat-rate fee or a per-share model? Is their payment for order flow model resulting in poor fill quality (slippage)? Do a thorough analysis.
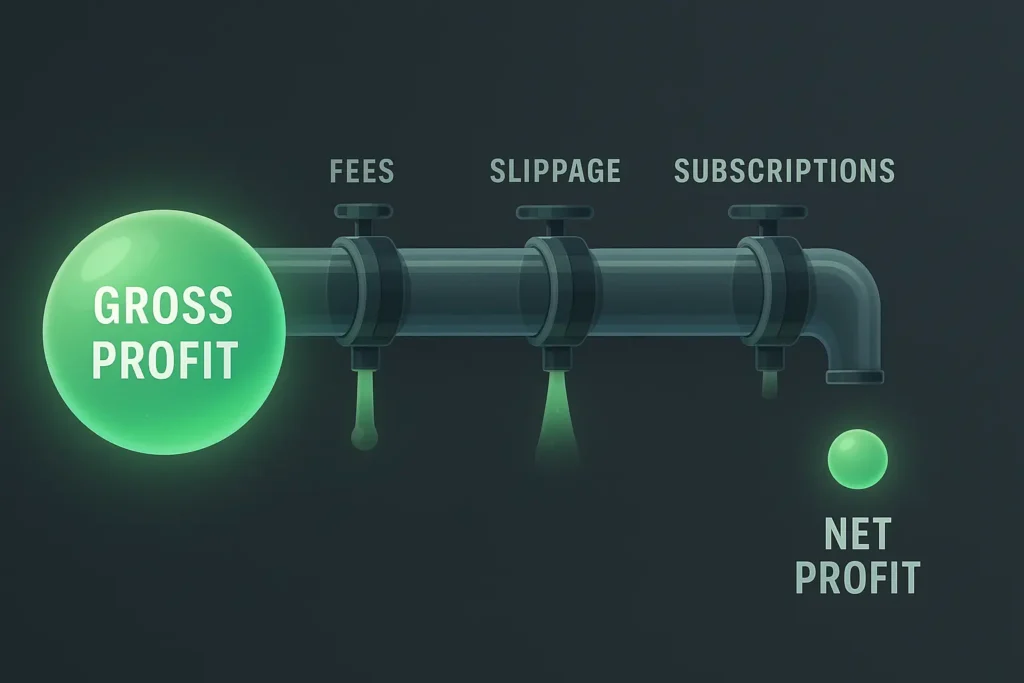
Conclusion: Trading is a Business, Account for Your Expenses
Profitable automated traders are not just good strategists; they are obsessive expense managers. They understand that a beautiful backtest is just a measure of potential gross revenue. It’s only after you subtract the four categories of real-world costs—fees, slippage, technology, and subscriptions—that you arrive at your true net profit.
Remember that high-frequency trading bot types like scalpers are the most vulnerable to these costs. Before you deploy, do the math, understand your “true cost per trade,” and ensure your strategy’s edge is large enough to overcome it.
For the complete picture, see how this crucial analysis fits into our main Algorithmic Trading Guide for Retail Traders.
Frequently Asked Questions About Automated Trading Costs
Why does my live trading P&L not match my backtest results?
Quick Answer: Because your backtest is a perfect-world simulation, while live trading is impacted by real-world “frictions” like fees, slippage, and latency.
A backtest assumes you get perfect fills at the exact price your signal triggered. In reality, you pay commissions, lose the bid-ask spread, and experience slippage (getting a slightly worse price). These small, cumulative costs, which are invisible in a basic backtest, create the “performance gap” between your simulated and actual profits.
Key Takeaway: A backtest shows your strategy’s gross potential; your live P&L shows your net profit after all real-world costs are deducted.
What is the single biggest hidden cost in automated trading?
Quick Answer: For most strategies, it’s slippage.
While commissions and fees are predictable, slippage is a variable and often invisible cost that can be significant. It’s the difference between your expected fill price and your actual fill price. For high-frequency bots that aim for small profits, a few cents of slippage on each trade can be the difference between a winning and losing system.
Key Takeaway: You must always estimate and account for slippage in your profitability calculations, as it can be more impactful than commissions.
How can a fast trading bot actually increase my costs?
Quick Answer: By aggressively chasing fast-moving prices with market orders, leading to high slippage.
This is the “speed paradox.” When a bot detects a breakout and sends a market order to “get in now at any price,” it can end up paying a much higher price than where the signal triggered. A human might wait for a small pullback, but a bot executing a market order will pay whatever it takes to get filled, maximizing slippage in volatile moments.
Key Takeaway: Speed is only an advantage if it’s used intelligently, often with limit orders, not just for chasing price with market orders.
Do I really need a VPS for my trading bot?
Quick Answer: Yes, if you are running any strategy that requires it to be online 24/7 or relies on a high-speed, stable connection.
Running a bot from your home computer is risky. Your residential internet can lag or disconnect, your computer could restart for an update, or a power outage could occur. A VPS (Virtual Private Server) is a professional solution that hosts your bot in a secure data center with redundant power and a high-speed, stable connection, ensuring it runs uninterrupted.
Key Takeaway: A VPS is a standard and necessary business expense for any serious automated trader.
Are market data fees a significant cost for trading bots?
Quick Answer: Yes, for professional-grade bots, data fees can be one of the largest monthly expenses.
The free or cheap data feeds offered by many brokers are often delayed or aggregated. Automated strategies require clean, real-time, direct-from-exchange data feeds to make accurate decisions. These professional-grade data feeds can cost hundreds of dollars per month depending on the markets you are trading.
Key Takeaway: Budgeting for high-quality data is a non-negotiable cost of running a professional automated trading system.
What’s the best way to reduce my trading costs?
Quick Answer: The two most effective methods are to reduce your trading frequency and use limit orders instead of market orders.
Every cost—commissions, spread, and slippage—is magnified by how often you trade. A lower-frequency swing trading bot is far less sensitive to costs than a scalping bot. Additionally, using limit orders protects you from negative slippage by defining the exact price you are willing to pay, though it carries the risk of not being filled.
Key Takeaway: Intelligent strategy selection (lower frequency) and order execution (limit orders) are your best tools for controlling costs.
How do I account for the bid-ask spread in my backtest?
Quick Answer: A simple method is to penalize every simulated round-trip trade by the asset’s average spread.
A basic backtest might assume you can buy and sell at the same “last” price. A more realistic backtest should assume you always buy at the higher “ask” price and sell at the lower “bid” price. By subtracting the typical bid-ask spread from each simulated trade’s profit, you get a much more accurate picture of the strategy’s real-world potential.
Key Takeaway: To make your backtest more realistic, you must programmatically include the cost of crossing the spread on every trade.
Can my own trading size increase my costs?
Quick Answer: Yes, this is known as “market impact.”
If you are trading with a size that is significant relative to the stock’s average volume, the act of your bot buying or selling will consume all available liquidity at the current price and push the price against you. This is a form of self-inflicted slippage. This is not a concern for most small retail traders but becomes a major factor as account size and trading frequency grow.
Key Takeaway: As your trading size grows, you must consider the market impact of your own orders as a direct trading cost.


