You’ve read about strategies. Trend following, pullbacks, breakouts, scalping—maybe you’ve even tried copying a few from YouTube or a trading course.
Here’s the problem: They didn’t work.
Not because the strategies were bad, necessarily. They failed because they weren’t built for you. Your personality, your schedule, your risk tolerance, your capital—none of it matched the approach you were trying to force yourself into.
That’s the square peg, round hole problem every trader faces. And it’s exactly why so many strategies that look brilliant on paper fall apart the moment real money hits the table.
Our team has seen it countless times. A scalping strategy that works perfectly for someone who thrives on rapid-fire decisions becomes torture for an analytical person who needs time to think. A swing trading approach that suits a patient trader drives an action-oriented person to force trades out of sheer boredom.
The solution? Stop copying. Start building.

This guide shows you how to develop a trading strategy that actually fits who you are, then test it rigorously before risking a single dollar. We’ll cover the self-assessment framework most traders skip, the complete strategy building blocks you need, and the backtesting process that separates hope from evidence.
Why Copying Strategies Often Fails (The “Square Peg, Round Hole” Problem)
Think about it. You try copying a super-fast scalping strategy because it looked exciting in a YouTube video. But you’re naturally a patient, analytical person who gets stressed by rapid-fire decisions. You’re going to hate it. You’ll likely make mistakes under pressure. Even if the strategy theoretically works for someone else, you’ll probably lose money.
Or maybe you try a long-term trend following approach, but you only have an hour a day to trade and you crave constant action. You’ll get bored, force trades that aren’t there, and miss the big picture the strategy relies on.
Your strategy needs to align with several crucial factors:
Your Personality: Are you patient or impatient? Action-oriented or analytical? Comfortable with uncertainty or needing frequent wins? These aren’t just personality quirks—research in trading psychology shows they directly impact which strategies you can actually execute consistently.
Your Risk Tolerance: Can you stomach a 20% drawdown? Do you prefer smaller, frequent wins or fewer, larger wins? How much capital can you realistically risk per trade and per day? Your stated risk tolerance often differs wildly from your actual tolerance once real money is on the line.
Your Schedule & Time Commitment: Can you be glued to the screen during market hours, or do you need a strategy that requires less constant monitoring? Do you have pre-market time? Can you trade the open?
Your Capital: Some strategies require more capital than others to handle wider stops or meet pattern day trader rules. A strategy that needs $30,000 to execute properly won’t work for a $5,000 account.
The Markets You Trade: Does the strategy suit the volatility and behavior of your chosen market? What works in forex might not translate to stocks or futures.
Your Understanding: Do you actually get the logic behind why the strategy should work? If you don’t understand it, you won’t trust it when it hits a rough patch.
If there’s a mismatch in any of these areas, you’re setting yourself up for frustration and failure. That’s why developing your own strategy—even if it starts by adapting existing concepts from our Day Trading Strategies Overview—allows you to tailor it to fit you.
Before You Build: The Self-Assessment Framework
Grab a notebook. This part isn’t optional.
Before you write a single trading rule, you need honest answers to these questions. Not the answers you think sound good. The actual truth.
Your Personality Traits:
- Do you make decisions quickly or do you need time to analyze?
- Are you comfortable acting with incomplete information?
- Do you handle losing streaks emotionally or analytically?
- Do you crave action and stimulation, or do you prefer patience and planning?
- Are you naturally disciplined with rules, or do you tend to bend them?
Your Actual Risk Tolerance:
- How much money can you lose in a single trade without it affecting your mood?
- What percentage drawdown would make you want to quit trading entirely?
- Do you recover quickly from losses, or do they bother you for days?
- Would you rather have a 60% win rate with 1:1 risk/reward, or 40% with 2:1?
Your Time Reality:
- How many hours per day can you actually dedicate to active trading?
- Can you be available during the first hour of market open?
- Can you monitor positions throughout the day?
- Do you need to trade around a full-time job?
Your Capital Constraints:
- How much capital do you have available for trading?
- Are you subject to the Pattern Day Trader rule (under $25,000)?
- How much can you risk per trade (1-2% is standard)?
- What’s your max daily loss limit?
Your Market Interests:
- Which markets naturally interest you? (Stocks, forex, futures, crypto)
- Do you understand the specific characteristics and risks of that market?
- Do you have access to the data and tools needed?
Write these answers down. They’re your strategy blueprint. Every rule you create needs to fit within these constraints, or you’re building something you can’t execute.

The Complete Strategy Building Blocks
A complete trading strategy isn’t just an entry signal. It’s a full set of rules covering every aspect of the trade. We’ve touched on these pieces throughout our strategy series, but let’s bring them together.
Think of these as non-negotiable components:
Market & Timeframe: What are you trading specifically (e.g., liquid large-cap stocks, major forex pairs, /ES futures)? When are you looking at it (e.g., 5-minute chart for entries, 1-hour chart for trend context)? Be specific.
Setup Conditions (The “Why”): What market environment needs to exist before you even start looking for an entry? This filters the market for your specific opportunity type. Example: “Price must be above the 50 EMA, and the market must show clear higher highs and higher lows.” Or: “Price must be in a defined range with clear support and resistance, and RSI must be between 40-60.”
Entry Trigger (The “When”): What exact event signals you to enter the trade? Be precise and objective. “Buy stop placed 1 tick above the high of a confirmed hammer candle that touches the 20 EMA.” No ambiguity. No “it looks good.” If someone else read your rule, could they take the exact same entry you would?
Stop Loss Placement (The “Uh Oh”): Where does your initial protective stop loss go? Base it on price structure, not arbitrary distances. “Stop placed below the low of the entry candle.” “Stop placed 2 ATR below entry.” “Stop placed below the most recent swing low.” For more on how stop losses work mechanically, see our guide on What is a Stop-Loss Order.
Position Sizing Rules (The “How Much”): How many shares or contracts do you trade based on your account size and the distance from entry to stop? This is typically risk-based: “Risk exactly 1% of account capital per trade.” Position sizing math gets detailed, which is why we have a dedicated Position Sizing for Beginners guide that walks through the calculations.
Profit Target / Exit Strategy (The “Ka-Ching”): How and when do you take profits? Be specific. “Target is 2x initial risk.” “Sell half at 1.5R, trail stop on the rest using the 20 EMA.” “Exit when price touches the opposite side of the channel.” “Exit on MA crossover against the position.” For understanding the risk/reward math here, check our Understanding Risk/Reward Ratio article.
Trade Management Rules (Optional but Helpful): Do you move your stop to breakeven at a certain point? Do you scale in or out? Under what conditions?
Write it all down. Every component. This becomes your trading plan—see our Building Your First Trading Plan template for the complete framework. Your plan is your strategy, codified and documented so you can test it objectively.

The 9-Step Strategy Development Process
Here’s how you actually create these rules from scratch:
Step 1: Honest Self-Assessment Go back to your notebook answers. These aren’t suggestions—they’re constraints. Your strategy must fit within them, or you’re wasting your time.
Step 2: Choose Your Playground Based on your self-assessment, select your market(s) and primary intraday timeframe(s). Don’t try to trade everything. Start focused. If you have $5,000 and work full-time, you’re probably not day trading small-cap stocks at the open. Be realistic.
Step 3: Pick ONE Core Concept What basic market behavior do you want to exploit? Don’t try to be a trend follower AND a range trader AND a scalper all at once. Choose one core idea that resonates with you and fits your time availability. “I want to trade pullbacks in established trends.” “I want to fade extremes in range-bound markets.” “I want to trade breakouts from consolidation.” Explore the core types in our Day Trading Strategies Overview.
Step 4: Select Your Tools Based on the concept, choose a small number of indicators or patterns you’ll use. Don’t create indicator soup with 12 different things on your chart. Maybe just a couple of moving averages and candlestick patterns for a pullback strategy. Or support/resistance lines and an oscillator for a range strategy. Keep it simple initially.
Step 5: Draft Specific Entry Rules Based on your concept and tools, write down exact entry criteria. “IF price is above 50 EMA, AND pulls back to touch 20 EMA, AND forms a hammer candle, THEN prepare to enter long.” The more specific, the better. This is where most people get vague—don’t.
Step 6: Draft Specific Stop Loss Rules Where will the stop go every time based on that entry? “Stop loss goes below the low of the hammer candle.” Structure-based stops work better than arbitrary distances.
Step 7: Draft Specific Profit Target Rules How will you exit winners? “Target is the most recent swing high.” “Target is 2:1 risk/reward ratio.” “Exit when price touches the opposite range boundary.” Again—specific.
Step 8: Define Risk Rules Set your percentage risk per trade (typically 1-2% of account) and your maximum daily loss limit. These are circuit breakers. For comprehensive risk principles, see our Introduction to Risk Management guide.
Step 9: Review & Refine (Initial) Read through your rules. Are they clear? Objective? Unambiguous? Could someone else trade them exactly the same way just by reading your document? If not, refine them until they are.
Now you have a hypothetical strategy. It sounds good on paper, maybe. But does it actually work? That’s where backtesting comes in.
What is Backtesting and Why It’s Absolutely Essential
Backtesting is the process of applying your precise strategy rules to historical market data to see how it would have performed in the past. You’re simulating trades based on your rules on old charts.
According to Investopedia’s backtesting research, this is “a term used in modeling to refer to testing a predictive model on historical data.” The underlying theory is straightforward: if a strategy performed poorly in the past, why would it magically work now? Conversely, seeing positive results builds crucial confidence to actually follow the rules when real money is on the line.
Why is it essential? Four big reasons:
Builds Confidence (or Destroys False Hope): It gives you objective data on whether your idea has any historical merit. If it failed miserably in the past across different market conditions, you just saved yourself real money by finding out on paper.
Identifies Flaws: Backtesting often reveals weaknesses in your rules you didn’t foresee. Maybe your stops are too tight and you’re getting chopped out of good trades. Maybe your targets are unrealistic. Maybe your entry signal is too vague and you’re getting different interpretations.
Helps Refine Rules: Based on the results, you can make data-driven adjustments. “Maybe I should wait for the RSI to also be below 50 for this long setup.” “Perhaps I need more confirmation before entering.” These adjustments come from evidence, not gut feeling.
Estimates Performance Metrics: It gives you a realistic idea of the strategy’s potential expectancy. You’ll learn:
- Win Rate: What percentage of trades were winners?
- Average Win / Average Loss: How much did you make on average winners vs. lose on average losers?
- Profit Factor: Gross profit divided by gross loss (ideally >1.5 or higher)
- Maximum Drawdown: What was the biggest peak-to-trough dip in equity? This matters psychologically.
- Trade Frequency: How many setups occurred over the test period?
Backtesting saves you real money. Finding out your strategy is flawed during backtesting costs you nothing but time. Finding out with real capital costs real dollars.
Manual Backtesting: The Grind (But It’s Worth It)
There are two main ways to backtest: manually or with code. Let’s start with manual.
How Manual Backtesting Works:
You literally scroll back on your charting platform to a point in the past—say, 6 months or a year ago. Then you advance the chart bar by bar (or candle by candle) on your chosen timeframe, hiding future price action so you can’t cheat with hindsight.
You look for setups that match your exact entry rules. When you see one, you log it in a spreadsheet:
- Entry date/time
- Entry price
- Initial stop loss price
- Target price
- Ticker symbol
Then you advance the chart until either your stop or target would have been hit. Log the exit price, profit/loss (in points, ticks, or R-multiples), and any notes about what you observed. Repeat hundreds of times across different market conditions—trending up, trending down, ranging, volatile, quiet.
Tracking Your Results:
Set up a simple spreadsheet. Track:
- Date and time of trade
- Ticker/pair
- Setup type
- Entry price
- Stop price
- Target price
- Exit price
- Result (win/loss in R-multiples)
- Notes
Pro tip from our testing: test multiple exit approaches simultaneously. Instead of just backtesting one single exit, come up with a few different exit scenarios. For example, test a 2:1 risk/reward target, a 3:1 target, and a trailing stop approach all with the same entry rules. This saves massive time and helps you find the best exit strategy without doing three separate backtests.
Pros of Manual Backtesting:
Forces you to internalize your rules. You’re training your brain to recognize setups in real-time. You get a real feel for how the strategy behaves bar-by-bar. It’s excellent for developing chart reading skills and “screen time.” And you don’t need any coding knowledge.
Cons of Manual Backtesting:
Extremely time-consuming. Testing hundreds of trades manually takes hours, days, or even weeks. It’s also prone to hindsight bias—it’s very easy to subconsciously cheat. Maybe you ignore a setup that looks like it failed because you can see what happened next. Maybe you manage a trade differently than your rules strictly allow because the future is visible. It requires immense discipline to be objective. And your sample size might be limited simply due to the time involved.
Most traders benefit from doing at least some manual backtesting to really learn the strategy and build chart-reading skills. The grind teaches you things code can’t.

Automated Backtesting: The Code (Faster, But More Complex)
With automated backtesting, you translate your precise strategy rules into code. The software then automatically runs these rules against historical data—often years’ worth—in seconds or minutes, spitting out detailed performance reports.
How Automated Backtesting Works:
You use a trading platform with built-in backtesting capabilities like TradingView’s Pine Script, NinjaTrader, MetaTrader, TradeStation, or dedicated software using Python or other languages. You code your exact rules—entry conditions, stop placement, position sizing, exit criteria—and the software tests every instance where your setup occurred in the historical data.
According to academic research on strategy evaluation, proper statistical testing requires rigorous methodology to separate genuine edge from random chance. The software can provide t-statistics and other measures to determine if results are statistically significant.
Pros of Automated Backtesting:
Incredibly fast. Test thousands of trades across years of data very quickly. It’s objective—the code follows the rules exactly as written, removing manual execution bias. You get large sample sizes, which allows for more statistically significant results. And you can run optimizations to test different parameter variations (though this comes with dangers we’ll discuss).
Cons of Automated Backtesting:
Requires coding skills or learning a platform-specific language. Can have a steep learning curve. There’s also the “garbage in, garbage out” problem—if your coded rules don’t perfectly match your intended strategy, the results are meaningless. Requires careful coding and debugging.
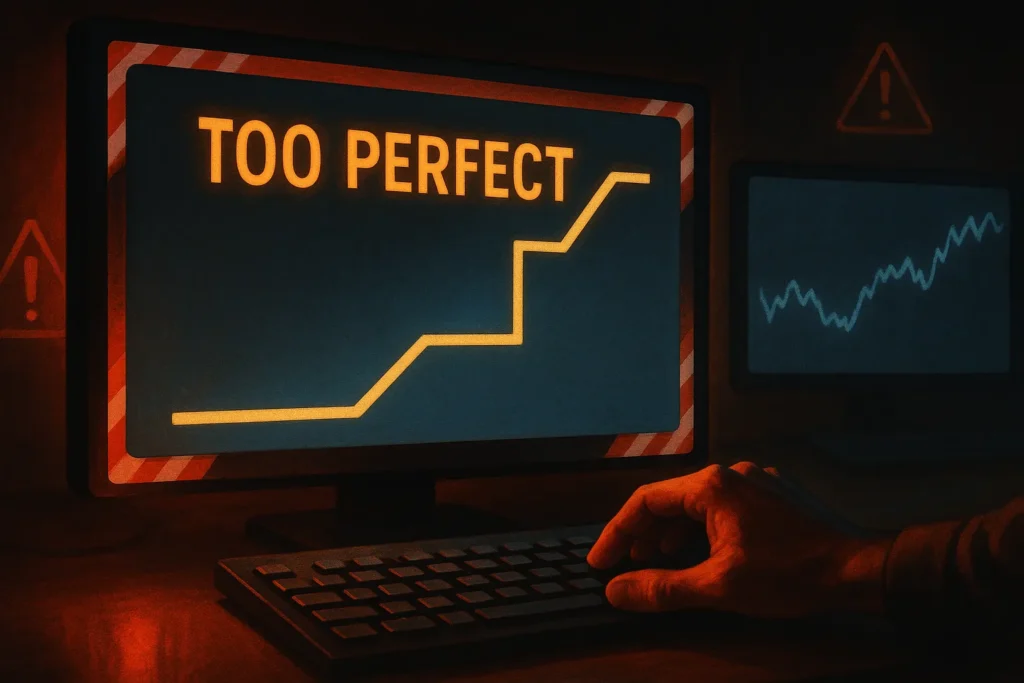
And here’s the big one: the risk of curve-fitting or over-optimization. It’s incredibly easy to tweak parameters until the strategy looks perfect on past data. But these “optimized” settings often fail miserably in live trading because you’ve simply fitted the noise of the past, not found a robust edge. You’ve created a strategy that works brilliantly on one specific historical period but falls apart everywhere else.
Walk-Forward Analysis: Advanced Validation
To combat curve-fitting, sophisticated traders use walk-forward analysis. This technique, considered the “gold standard in trading strategy validation” according to industry research, works by repeatedly optimizing on a training set (in-sample data), testing on the period after the set (out-of-sample data), and then rolling it all forward.
You optimize on January-March data, test on April. Then you optimize on February-April, test on May. And so on. If the strategy performs well consistently across multiple out-of-sample periods, it’s more likely to be robust rather than curve-fit. This is advanced stuff, but worth knowing about as you develop your testing skills.
Key Backtest Metrics: What the Numbers Actually Mean
After running your backtest—manual or automated—you’re staring at a spreadsheet full of numbers. What should you actually look for?
Positive Expectancy (The Foundation): Does it make more than it loses over a large sample size? Your profit factor (gross profit / gross loss) should be greater than 1.0. Ideally, you want it above 1.5 or higher. Anything below 1.0 means you’re losing money over time. Simple as that.
Win Rate (Not As Important As You Think): This is the percentage of winning trades. A 60% win rate sounds great, but it’s meaningless without context. You can be profitable with a 40% win rate if your average winners are much larger than your average losers. Conversely, you can lose money with a 60% win rate if your losers outweigh your winners. Win rate is only one piece of the puzzle—see our Understanding Risk/Reward Ratio guide for the complete picture.
Average Win vs. Average Loss (The Real Story): This tells you your actual risk/reward ratio. If your average winner is $200 and your average loser is $100, that’s a 2:1 ratio. Combined with win rate, this gives you expectancy. A 40% win rate with 2:1 R/R is still profitable.
Profit Factor (Quick Health Check): Gross profit divided by gross loss. A profit factor of 2.0 means for every dollar you lost, you made two. Anything above 1.5 is generally solid. Below 1.2 gets questionable. Above 3.0 might mean you’re either testing on perfect data or you’ve over-optimized.
Maximum Drawdown (The Psychological Test): This is the biggest peak-to-trough decline in your account during the backtest. Could you mentally handle that drawdown without abandoning the strategy? Be honest. If the backtest shows a 30% drawdown and you know you’d panic at 15%, the strategy isn’t for you regardless of the other numbers.
Sharpe Ratio (Risk-Adjusted Returns): This measures return per unit of risk taken. A Sharpe ratio above 1.0 is decent, above 2.0 is excellent. It’s particularly useful for comparing different strategies—which one gives you better returns for the risk you’re taking?
Trade Frequency (Practical Usability): Does it generate enough trades to be practical and statistically meaningful? A strategy that only signals twice a year isn’t very useful for day trading. On the flip side, 50 trades per day might be unrealistic to execute. Find the sweet spot.
Expectancy (Per-Trade Expected Value): This is the average amount you can expect to make (or lose) per trade. It’s calculated as: (Win Rate × Average Win) – (Loss Rate × Average Loss). If your expectancy is positive over a large sample, you have an edge.
Be realistic about results. No strategy wins all the time. Look for a demonstrable edge—even if modest—combined with manageable drawdowns. And always assume live results will be somewhat worse than backtested results due to factors like slippage, commissions, and imperfect execution under stress.
Common Backtesting Pitfalls (How to Fail Spectacularly)
Even with the best intentions, it’s easy to fool yourself. Here are the landmines:
Overfitting / Curve-Fitting (The Most Dangerous): This happens when you backtest the same historical period multiple times, tweaking your rules based on each result. You look at your losses and add rules to avoid them, then backtest the same data again. You keep doing this until the strategy looks perfect on that specific chunk of history.
The problem? You’ve created a strategy that’s too sensitive—it fits the specific noise of that particular period but has no real edge. As research on backtesting limitations notes, “it is often possible to find a strategy that would have worked well in the past, but will not work well in the future.”
Better approach: Analyze your backtest results, come up with improvements, then test those adjusted rules on a completely new, unseen historical period. That’s more robust.
Hindsight Bias (Manual Testing Trap): When you can see the future on the chart, it’s incredibly hard to be objective. You might unconsciously avoid trades you know failed, or manage winners differently because you can see the exit coming. The only defense is iron discipline—pretend you truly don’t know what happens next.
Data Snooping / P-Hacking: This is testing many random variations of parameters without a proper hypothesis and only focusing on the ones that performed well. “Let’s test 100 different moving average combinations and see which one worked best!” That’s not strategy development—that’s fishing for luck. Academic research shows this leads to false discoveries.
Look-Ahead Bias: Including information in your backtest that wouldn’t have been available at the time. Example: using end-of-day closing prices that publish at 4pm to make decisions you’d need to make at 2pm. Always ask: “Would I have actually known this information at this moment?”
Ignoring Transaction Costs: Commission fees, spreads, slippage—these eat into every trade. A strategy that shows 0.5% per trade might be unprofitable after costs. Always include realistic estimates of what you’ll actually pay. For high-frequency strategies, costs can completely eliminate apparent edge.
Insufficient Sample Size: Testing 15 trades and declaring victory is meaningless. You need at least 30-50 trades for initial confidence, ideally 100+ for statistical significance. Anything less and you’re just measuring noise.
Cherry-Picking Timeframes: Only testing bull markets when your strategy is designed for trends. Or only testing range-bound periods when your strategy is designed for breakouts. Test across different market conditions—trending up, trending down, ranging, volatile, quiet—to see if the strategy is truly robust.
Forward Testing: The Bridge to Live Trading
Your backtest looks promising. Are you ready for real money?
No. Not yet.
Backtesting tells you how the rules worked on past data. Forward testing—also called paper trading—tells you how the rules work in the current market environment AND, just as importantly, how YOU execute those rules under simulated live conditions.
What is Forward Testing:
Take your exact, finalized strategy rules (the ones you backtested) and trade them in real-time using your broker’s paper trading simulator or a demo account. No real money. But real market conditions, real emotions, real execution challenges.
Our guide on Why Paper Trading is Non-Negotiable for Beginners explains the importance in detail, but here’s the short version: forward testing confirms if the edge still exists in current markets and tests your ability to follow the rules without hesitation or emotional interference.
Why Backtest Results ≠ Guarantee:
Market conditions change. Volatility shifts. The specific price patterns that worked beautifully in 2022 might not appear the same way in 2025. Or maybe they do appear, but there’s now different institutional activity around them.
Forward testing in the current environment tells you if your strategy still has relevance now.
Duration Recommendations:
Don’t just paper trade for a day or two. Do it for weeks, or even months. Generate a decent sample size of live simulated trades using your exact strategy rules—aim for 50-100 trades. Track the results just like you did in backtesting.
Track not just the outcomes, but your emotional state. Did you hesitate on entries? Did you exit early out of fear? Did you break your rules when the trade moved against you? These are the real issues that will plague you in live trading. Better to identify them in simulation.
Only when you’ve achieved consistent profitability on paper, following your plan religiously, should you consider trading the strategy with real—but very small—starting capital. Our guide on How to Use a Paper Trading Account Effectively walks through the mechanics.

The Continuous Refinement Cycle
Here’s something most trading courses don’t tell you: strategy development isn’t something you do once and forget. It’s an ongoing process.
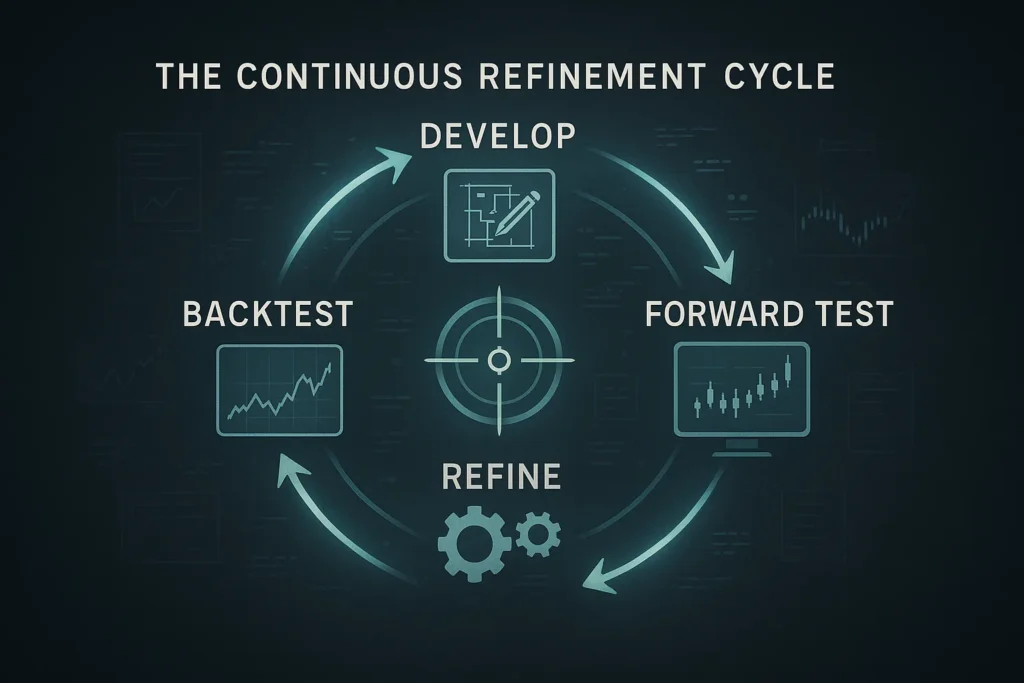
The Cycle:
Develop the initial rules → Backtest rigorously → Forward Test to confirm → Trade Live (Small Size) → Monitor & Journal → Refine based on data → Re-test
It takes time, patience, and a commitment to objective analysis. There are no shortcuts to developing a robust trading edge. Markets evolve. Volatility changes. What worked last year might need adjustment this year.
The key word is “data-driven.” Don’t tweak your strategy because you’re frustrated after three losses. Don’t abandon it after one bad week. But if you track 100 trades and notice a specific pattern—like your strategy underperforms in low-volume conditions—that’s actionable data for refinement.
Then you adjust the rules slightly, backtest the adjusted version on new data, forward test it, and see if it’s an improvement. Rinse and repeat.
This is also where Strategy-Specific Risk Management comes in—as you refine your approach, your risk parameters might need adjustment too.
Tools to Accelerate Your Process
You don’t need to do everything from scratch. Smart traders use tools to accelerate the process:
Scanners for Finding Setups: Once you’ve defined your strategy rules, you need actual market data to test against. This is where scanners become invaluable—they filter thousands of stocks down to the ones that match your criteria.
Advanced scanners like Trade Ideas can help you identify historical setups that match your exact specifications, making manual backtesting far more efficient. Instead of scrolling through random charts hoping to find your setup, you can pull up specific instances where your conditions were met.
While Trade Ideas doesn’t backtest strategies directly, its AI-powered Holly can help you discover high-probability setups to incorporate into your strategy development process. As you refine your strategy, Trade Ideas’ real-time scanners can validate whether your setups are actually occurring in current market conditions—crucial information for forward testing. Learn more in our comprehensive Trade Ideas Review.
For beginners exploring scanner options, check our complete Stock Scanners for Day Trading guide.
TradingView Bar Replay: For manual backtesting, TradingView’s Bar Replay feature is excellent. You can scroll back to any historical date and replay price action bar-by-bar, hiding future data. It’s intuitive and doesn’t require coding.
Other Backtesting Software: For automated testing, platforms like NinjaTrader, Amibroker, MetaTrader, and TradeStation offer robust backtesting engines. Python users can use libraries like Backtrader or QuantConnect. Each has pros and cons—research which fits your skill level and needs.
Journal Tools: Platforms like Edgewonk or TraderSync help you track both backtest results and live trading performance systematically. Good record-keeping is non-negotiable.
FAQ: Your Strategy Development Questions Answered
How do you develop your own trading strategy?
Quick Answer: Start with self-assessment (personality, risk, time, capital), choose one core concept that fits you, draft specific rules for entry/stop/target, then backtest rigorously before live trading.
The key is alignment. Your strategy must fit your actual constraints—not what sounds cool, but what you can realistically execute. Begin by honestly assessing your personality traits, risk tolerance, available time, and capital. Then pick ONE core concept (trend following, range trading, breakout trading, etc.) that resonates with you. Draft very specific, objective rules for every component: market selection, entry trigger, stop loss placement, position sizing, and profit targets. Test those rules on historical data to see if they have an edge. Only strategies that fit YOU and show positive expectancy in testing are worth pursuing.
Key Takeaway: Strategy development is about personal fit first, statistical edge second—build something you can actually execute consistently. Use our Trading Plan Template to document your complete strategy.
What is backtesting and why is it important?
Quick Answer: Backtesting applies your trading rules to historical data to see how the strategy would have performed in the past, giving you objective evidence of whether it has an edge before risking real money.
Backtesting research shows it’s “a term used in modeling to refer to testing a predictive model on historical data.” You simulate your strategy on old charts bar-by-bar, recording every trade your rules would have triggered. This provides critical performance metrics: win rate, profit factor, maximum drawdown, trade frequency, and expectancy. Backtesting identifies flaws in your rules, builds confidence (or saves you from a bad strategy), and estimates realistic performance expectations. It’s the only way to gather objective data about your strategy without risking capital.
Key Takeaway: Backtesting turns hope and theory into evidence and statistics—it’s your first line of defense against unprofitable strategies.
How do I backtest a strategy manually?
Quick Answer: Scroll back on your chart platform to a past date, hide future price action, advance bar-by-bar looking for setups matching your rules, log each trade in a spreadsheet, and track results for 50-100+ trades.
Manual backtesting requires discipline but builds invaluable chart-reading skills. Start by going back 6-12 months in your charting platform (more for higher timeframes). Use TradingView’s Bar Replay or similar features that hide future data. Advance the chart one candle at a time, looking for setups that match your exact entry criteria. When you find one, record entry price, stop price, target price, and then advance until either stop or target is hit. Log the result (win/loss in R-multiples) in a spreadsheet. Take screenshots for review later. Repeat across different market conditions until you have at least 50-100 simulated trades. The main challenge is avoiding hindsight bias—you must pretend you don’t know what happens next.
Key Takeaway: Manual backtesting is time-intensive but forces deep strategy internalization that automated testing can’t provide—plan for 10-20+ hours minimum.
What’s the difference between backtesting and forward testing?
Quick Answer: Backtesting applies your rules to historical data that already happened; forward testing (paper trading) applies your rules to current market conditions in real-time with simulated money.
Backtesting looks backward—you’re testing on data that’s already complete, seeing how your strategy would have performed historically. Forward testing looks forward—you’re executing your strategy in real-time as price action unfolds, but using a paper trading account with fake money. Forward testing is critical because it validates whether your backtested edge still exists in current market conditions and reveals execution challenges you’ll face with real money (hesitation, emotional stress, rule-breaking). Both are essential stages: backtest to validate the theoretical edge, forward test to validate current relevance and your ability to execute.
Key Takeaway: Backtest proves past viability, forward test proves current viability and execution capability—don’t skip either step. See our Paper Trading guides for implementation.
How many trades do I need to backtest for valid results?
Quick Answer: Minimum 30-50 trades for initial confidence, ideally 100+ trades for statistical significance, and across multiple market conditions (trending up/down, ranging, volatile).
Sample size matters enormously. Statistical research on trading strategies shows that small samples can’t distinguish genuine edge from random luck. With 15 trades, even a few lucky winners can make a bad strategy look good—or vice versa. You need at least 30-50 trades for preliminary confidence. For robust validation, aim for 100+ trades. More importantly, test across different market environments: bull trends, bear trends, range-bound periods, high volatility, low volatility. A strategy that only works in one condition isn’t robust. The goal is enough data across varied conditions to confidently estimate true expectancy.
Key Takeaway: 30 trades is the bare minimum, 100+ trades across varied conditions gives genuine statistical confidence—don’t declare victory (or defeat) too early.
What is curve-fitting and how do I avoid it?
Quick Answer: Curve-fitting (overfitting) occurs when you optimize rules so perfectly to past data that they fit noise rather than genuine patterns—avoid it by testing on new, out-of-sample data after optimization.
Curve-fitting is the biggest trap in backtesting. It happens when you repeatedly tweak your strategy rules to make past results look perfect. Example: “If I change this MA length from 20 to 23, and add this RSI filter between 47-52, my backtest shows 80% win rate!” Problem is, you’ve fitted the specific random noise of that particular historical period. Research shows overfitted strategies “may perform well on historical data but fail in live trading.” To avoid it: (1) limit the number of parameters you optimize, (2) always test optimized rules on completely new, unseen data (out-of-sample testing), (3) use walk-forward analysis if possible, and (4) favor simpler strategies with fewer moving parts.
Key Takeaway: If it looks too perfect, it probably is—robust strategies work consistently across multiple data sets, not perfectly on one.
What makes a good backtest result?
Quick Answer: Positive expectancy (profit factor >1.5), manageable drawdown you can psychologically handle, consistent performance across different market conditions, and sufficient trade frequency to be practical.
A “good” backtest isn’t just about high win rate or massive returns—those can be misleading. Look for: (1) Positive expectancy over large sample—your strategy makes more than it loses on average, (2) Profit factor above 1.5 ideally, (3) Maximum drawdown that won’t psychologically destroy you (if you can’t handle 25% drawdown, a 30% drawdown backtest should concern you), (4) Consistency across timeframes and market conditions, (5) Realistic win rate (40-60% is normal; 80%+ might be overfitted), (6) Acceptable trade frequency (enough setups to be useful, not so many you can’t execute them), and (7) Risk-adjusted returns (Sharpe ratio >1.0). Most importantly, assume live results will be 20-30% worse than backtest due to slippage and execution realities.
Key Takeaway: Good results are consistent, robust, and psychologically tradeable—perfection on paper usually means problems in practice.
Should I paper trade before live trading?
Quick Answer: Absolutely yes—paper trading (forward testing) validates your backtested strategy works in current markets AND that you can execute it without emotional interference.
Backtesting shows your strategy had an edge historically. But markets change, and more importantly, YOU haven’t been tested. Paper trading solves both problems. It validates whether your edge still exists in the current market environment (crucial, since conditions shift). More critically, it reveals your execution challenges: Do you hesitate on entries? Exit winners too early? Break rules under stress? Better to discover these issues with fake money than real capital. Our Why Paper Trading is Essential guide covers this comprehensively. Paper trade for weeks or months until you generate 50-100+ trades following your exact rules. Only when you’re consistently profitable on paper should you even consider tiny live capital.
Key Takeaway: Paper trading is your dress rehearsal—don’t skip straight to opening night with real money on the line. Follow our How to Use Paper Trading Account guide for best practices.
What is walk-forward analysis?
Quick Answer: Walk-forward analysis repeatedly optimizes strategy parameters on training data (in-sample), then tests on subsequent data (out-of-sample) in rolling windows—it’s the “gold standard” for preventing curve-fitting.
Walk-forward analysis (WFA) is an advanced validation technique that combats overfitting. Instead of one backtest on all your data, you split it into multiple segments. You optimize your strategy on segment 1 (January-March), then test those optimized parameters on segment 2 (April). Next, you optimize on segments 1-2 combined (January-April), then test on segment 3 (May). You keep rolling forward through all your data. Each out-of-sample period tests whether your optimization genuinely found robust parameters or just fit noise. If performance degrades badly in out-of-sample testing, your strategy isn’t robust. Industry research confirms WFA is “considered the gold standard in trading strategy validation.” It’s complex but prevents the false confidence that comes from simple backtesting.
Key Takeaway: Walk-forward analysis is advanced, but it’s the most robust way to validate strategy parameters—strategies that pass walk-forward testing are far more likely to work live.
How long should I forward test a strategy?
Quick Answer: Forward test for at least 50-100 trades or several weeks to months depending on trade frequency—long enough to experience different market conditions and confirm edge persistence.
There’s no magic number, but you need sufficient sample size and time. If your strategy generates 5 trades per day, a few weeks might suffice to accumulate 50-100 trades. If it generates 2 trades per week, you’ll need several months. The goal is experiencing varied market conditions during forward testing: strong trends, choppy ranges, high volatility, quiet periods. Does your edge persist across these changes? You’re also testing yourself—can you follow the rules consistently over time without emotional drift? Most experienced traders forward test for at least 1-3 months before committing real capital. Some are more conservative and forward test for 6+ months. The longer you wait, the more confidence you’ll have, but you’re also delaying potential profits from a working strategy. Find your personal balance point.
Key Takeaway: Minimum a few weeks, ideally 1-3+ months with 50-100 simulated trades—better to over-test than under-test before risking real money.
Wrapping Up: Your Edge is Personal and Proven
Finding success in trading isn’t about discovering some secret strategy nobody else knows. It’s about finding or developing a strategy with a demonstrable edge that fits you specifically, and then having the discipline to execute it consistently while managing risk.
The process involves honest self-reflection (which most people skip), clear rule definition (which most people avoid because it’s hard), and rigorous testing—first on historical data to see if the idea even has potential, and then in a simulated live environment to see if it works now and if you can actually trade it.
Don’t be discouraged if your first few ideas don’t pan out in testing. That’s normal. That’s exactly why we test—failure during testing saves you money. Keep learning, keep observing, keep testing, and focus on building that personal edge brick by brick.
The strategies that work are the ones that fit who you are, pass objective testing, and that you can execute without hesitation. Everything else is just noise.
Disclaimer
The information provided in this article is for educational purposes only and should not be considered financial advice. Day trading involves substantial risk and is not suitable for every investor. Past performance is not indicative of future results. Backtesting and paper trading do not guarantee future profitability.
For our complete disclaimer, please visit: https://daytradingtoolkit.com/disclaimer/
Article Sources
This article was researched and written using the following authoritative sources:
- Investopedia – Backtesting Definition – Comprehensive overview of backtesting methodology, common pitfalls including overfitting and look-ahead bias, and the importance of out-of-sample testing validation.
- Wikipedia – Backtesting – Technical definition and academic perspective on backtesting as retrodiction and cross-validation, limitations including overfitting potential, and institutional usage requirements under Basel regulations.
- Corporate Finance Institute – Trading Psychology – Research on how personality traits, biases, and emotional factors impact trading decisions and strategy selection.
- QuantifiedStrategies – Personality Test for Traders – Brett Steenbarger’s research on personality traits that distinguish successful from unsuccessful traders, particularly the correlation between conscientiousness and systematic trading success.
- Journal of Portfolio Management – Evaluating Trading Strategies – Academic standards for statistical significance in backtesting, including t-statistics and sigma levels for validating strategy robustness.
- SSRN – A Profitable Day Trading Strategy for the U.S. Equity Market – Comprehensive research on Opening Range Breakout strategies tested across 7,000+ stocks from 2016-2023, demonstrating thorough backtesting methodology with stock-level granularity.


