
Last time we chatted about Trend Following with Moving Averages, we dug into using Moving Averages to figure out the market’s trend and even touched on using them as dynamic support or resistance for entries. Now, let’s really zoom in on that second idea, because it’s a cornerstone strategy for many trend followers: Trading Pullbacks.
You’ve probably heard the phrases “buy the dip” or “sell the rip.” That’s essentially what pullback trading is all about. Instead of chasing a stock after it’s already made a big move up—which often feels like showing up late to the party and getting a bad seat—you wait patiently for it to take a little breather, pull back towards a support level, show signs of wanting to go back up, and then you jump in. In a downtrend, it’s the mirror image: wait for a temporary rally back up to resistance, see signs of sellers stepping back in, and then look to short it.
Why is this such a popular approach? Because, ideally, it offers a lower-risk, higher-potential-reward entry into an already established trend compared to just buying breakouts or chasing momentum blindly. You’re trying to get in sync with the market’s natural ebb and flow.

What Is a Pullback in Trading?
Before we get tactical, let’s nail down exactly what we mean by a pullback. A pullback is a temporary counter-trend move within a larger, established trend. Think of it as the market catching its breath. In an uptrend, price is making higher highs and higher lows overall, but during a pullback, it dips down—often to a support level like a moving average or previous resistance-turned-support—before resuming the upward move.
Here’s the key distinction: a pullback doesn’t change the underlying trend structure. The trend remains intact. We’re talking about temporary pauses, typically 5-10% moves that last only a few trading sessions. These aren’t major trend reversals—they’re natural corrections that happen when short-term traders take profits after a strong run.
Research from behavioral finance shows that these temporary reversals are driven by market psychology. Professional traders display what’s called “loss aversion” and the “disposition effect”—the tendency to sell winners too early while holding losers. After a strong move, profit-taking creates selling pressure that causes price to dip, even when the fundamental story and longer-term trend haven’t changed.
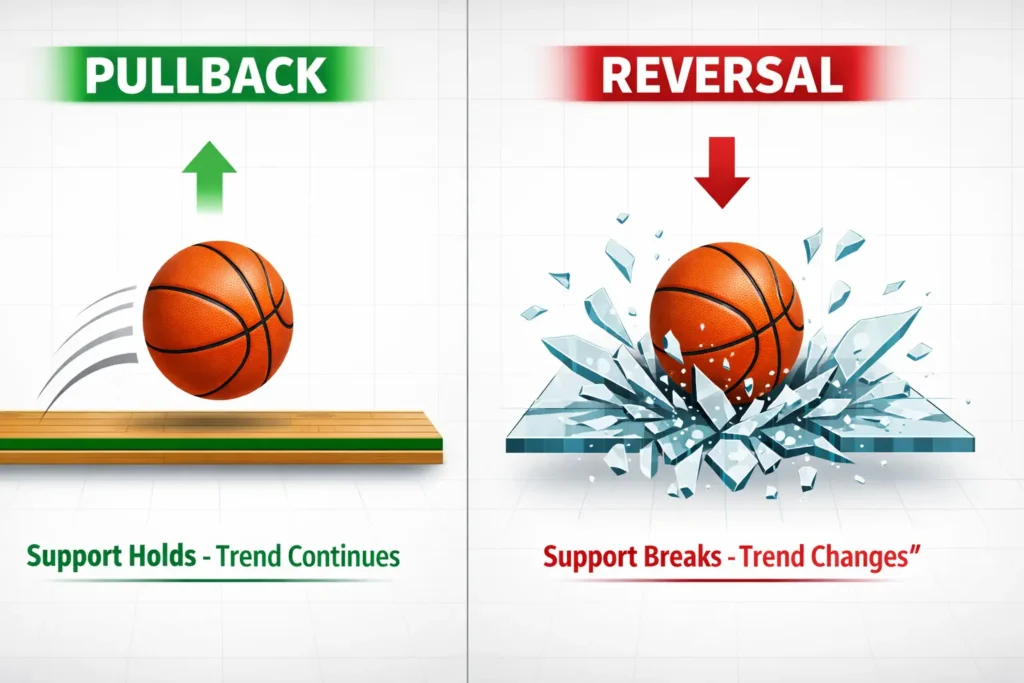
Pullback vs. Retracement vs. Reversal: What’s the Difference?
Here’s where a lot of traders get tripped up. These three terms sound similar, but knowing the difference can save you from expensive mistakes. Let’s break it down:
Pullback: A temporary dip or pause within an ongoing trend. Price pulls back, then resumes in the original direction. Duration? Typically a few sessions to a week. The trend structure—those higher highs and higher lows in an uptrend—stays intact.
Retracement: This term is basically interchangeable with pullback. You’ll often hear them used the same way. Some traders use “retracement” when they’re specifically measuring the depth of the pullback using Fibonacci levels, but functionally they mean the same thing: a temporary counter-move.
Reversal: This is the big one. A reversal is a complete change in trend direction. We’re not talking about a temporary dip—we’re talking about the trend actually ending and a new trend beginning in the opposite direction. In an uptrend reversal, price breaks below key support, makes lower lows, and establishes a downtrend. This is what you want to avoid when trading pullbacks.
Here’s a quick comparison:
| Factor | Pullback/Retracement | Reversal |
|---|---|---|
| Duration | Short-term (days to 1-2 weeks) | Long-term (weeks to months) |
| Cause | Profit-taking, consolidation | Fundamental change, institutional selling |
| Trend Structure | Maintained (higher lows in uptrend) | Broken (lower lows in uptrend) |
| Volume | Often decreasing during the dip | Often increasing as trend breaks |
| Key Levels | Holds above major support (50 MA, 200 MA) | Breaks through major support decisively |
| Outcome | Price resumes original trend | New trend established in opposite direction |
The million-dollar question: how do you tell them apart in real-time? That’s where technical analysis comes in—and we’ll cover the specific tools in just a moment. For now, remember: pullbacks respect support levels and maintain the trend structure. Reversals slice through support and break the pattern. If you want to dive deeper into spotting actual reversals, check out our guide on Spotting Market Reversals.
Why Do Pullbacks Even Happen? It’s Market Breathing Room
Think about it: markets rarely move in perfectly straight lines. Even the strongest trends have counter-trend moves, little pauses, or corrections along the way. Why?
Profit Taking: Traders who got in earlier on the trend start taking some profits off the table after a strong run. This selling pressure causes a temporary dip. It’s not that they think the trend is over—they’re just locking in gains. Some of them might even buy back in lower during the pullback itself.
Consolidation: The market needs to “catch its breath” and digest the recent move. Buyers might pause, sellers might test the waters, and price churns a bit before potentially resuming the trend. This is healthy. A trend that goes straight up without any pullbacks is often a sign of euphoria that can end badly.
Testing Commitment: Pullbacks test the conviction of the buyers (in an uptrend) or sellers (in a downtrend). If the trend is truly strong, new participants will step in at the better prices offered during the pullback, absorbing the selling pressure and pushing prices back in the trend’s direction. It’s like the market asking: “Do you really believe in this trend?”
Algorithmic Activity: Many trading algorithms are programmed to buy or sell at specific technical levels, including key moving averages or retracement levels. When price hits these zones, you’ll often see a reaction—sometimes creating the perfect entry for pullback traders.
Understanding why pullbacks happen helps you see them not as scary potential reversals, but as potentially healthy pauses within a larger trend—opportunities to join the party at a discount.
Spotting Potential Pullback Zones: Where Might Price Pause?
Okay, so we want to buy the dip in an uptrend. But which dip? How deep will it go? Where should we start looking for signs of buyers returning? This is where technical analysis tools become your best friends. Here are the most reliable ways our team identifies potential pullback support zones (just reverse these for resistance in downtrends):
Moving Averages: Your Dynamic Support Levels
As we discussed in detail in our Moving Averages guide, key moving averages often act as dynamic support in uptrends and resistance in downtrends. Price will often pull back to:
Short-term MAs (like the 9 EMA or 20 EMA): In very strong, fast-moving trends, price might only pull back this far before taking off again. These are shallow pullbacks. If you’re day trading, these are often your go-to levels on an intraday chart.
Medium-term MAs (like the 50 EMA/SMA): Often acts as a more significant support level in established trends. A pullback to the 50 MA can offer a solid entry point if the longer-term trend is intact. This is probably the most popular pullback level for swing traders.
Longer-term MAs (like the 200 EMA/SMA): A pullback all the way to the 200 MA on an intraday chart might suggest the trend is weakening, but it can still sometimes act as major support for a potential bounce, especially if the daily chart trend is still up.
The key? In a strong uptrend, price should bounce off these MAs. If it slices through decisively, that’s your warning sign that this might be more than just a pullback.
Fibonacci Retracement Levels: The Golden Ratios
Whoa, Fibonacci? Sounds fancy, but the basic idea is pretty simple for our purposes. It’s based on the concept that after a significant price move, prices tend to retrace a predictable portion of that move before continuing in the original direction.
How it Works: You use a charting tool to draw Fibonacci levels from the start of the recent swing low to the end of the recent swing high (in an uptrend). The tool automatically plots horizontal lines at key Fibonacci percentage levels: 38.2%, 50%, and 61.8% are the most commonly watched retracement levels.
The Idea: These levels often act as potential support where a pullback might stall and reverse back into the trend. The 50% level isn’t technically a Fibonacci number, but it’s widely watched as a halfway point—psychologically significant. The 61.8% level (the “Golden Ratio”) is often considered a particularly significant potential reversal zone.
Using it for Pullbacks: If price is pulling back in an uptrend, you watch these Fib levels. Does the pullback stall near the 38.2%? The 50%? The 61.8%? These become potential zones to look for buy signals.
Important Note on Fibs: They aren’t magic! They work best when they coincide with other forms of support or resistance—like a moving average or a previous price level. This is called confluence. A pullback stalling at the 50% Fib level which also happens to be right where the 50 EMA is sitting? That’s a much higher probability zone to watch than a Fib level floating in empty space.
Previous Support/Resistance Levels
Remember basic Support and Resistance? Old resistance, once broken, often becomes new support. Old support, once broken, often becomes new resistance.
How it Works: Look left on your chart! Did price recently break above a clear resistance level? During the next pullback, that old resistance level might now act as support. Price might dip back down to test that level before bouncing higher.
Using it for Pullbacks: Identify these key horizontal price levels from recent price action. As price pulls back towards a former resistance level (now potential support), watch for signs of buyers stepping in. These levels carry psychological weight because that’s where traders made decisions before.
Trendlines and Channels
If you can draw a clear trendline connecting the lows in an uptrend (or highs in a downtrend), that trendline itself can act as dynamic support (or resistance). We cover this extensively in our Trendlines & Channels guide, but here’s the quick version for pullback trading:
How it Works: Draw a line connecting at least two (preferably three or more) significant swing lows in an uptrend. Extend the line out to the right.
Using it for Pullbacks: As price pulls back towards this rising trendline, watch for it to hold as support and provide a potential entry point. Similarly, in a channel, the lower line can be support in an uptrend, and the upper line resistance in a downtrend.
The Power of Confluence
Again, none of these tools work perfectly in isolation. The highest probability pullback trades often occur where multiple potential support levels line up in the same area. For example:
- Price pulls back to the 50 EMA…
- …which happens to be right at the 61.8% Fibonacci retracement level…
- …and it’s also near a previous horizontal resistance level that was recently broken.
THAT’s a confluence zone, and it’s a much stronger area to look for a potential bounce than any single indicator on its own. Think of it as stacking the odds in your favor.

Waiting for Confirmation: Don’t Jump the Gun
Okay, so you’ve identified a potential pullback zone where multiple support factors align. Price is heading right for it. Do you just blindly place a buy order there?
Heck no!
This is where so many traders mess up. They see price approaching the zone and jump in too early, only to watch it slice right through. Or they buy the second it touches the zone, without waiting to see if buyers are actually showing up. We get it—FOMO is real—but patience here is what separates the profitable pullback traders from the frustrated ones.
You MUST wait for confirmation that the pullback is likely ending and the trend is resuming.

Bullish Candlestick Patterns
As price hits your support zone, look for reversal candles like:
Hammer: Small body near the top, long lower wick sticking down into the support zone. Shows buyers rejected lower prices and stepped in aggressively.
Bullish Engulfing: A strong green candle that completely engulfs the body of the previous small red candle. Shows strong buying pressure stepping in and overwhelming the sellers.
Morning Star: A three-candle pattern indicating a potential bottom—a bearish candle, a small indecisive candle, then a strong bullish candle.
These patterns aren’t foolproof, but they give you visual evidence that the battle between buyers and sellers is starting to tip back in the trend’s favor.
Price Action Signals
Beyond specific candle patterns, watch the price action itself:
Does price stall at the level? Does it stop making lower lows on that pullback and start making a higher low? Does it start to curl back up? These are all signs that support is holding and buyers are stepping in.
Volume Clues: The Unsung Hero
Here’s something that doesn’t get talked about enough: volume during the pullback. In a healthy pullback, you want to see volume decreasing as price dips. Why? Because light volume on the dip means there isn’t strong conviction from the sellers. It’s just profit-taking and a pause, not a serious threat to the trend.
Then, when price starts to bounce off the support zone, you want to see volume increase again. This suggests conviction from the buyers—they’re stepping in with size, not just nibbling. Rising volume on the bounce confirms that the trend is resuming with strength.
RSI and Momentum Indicators
The Relative Strength Index (RSI) can be incredibly useful for pullback trading, especially when you understand what to look for:
In a strong uptrend, a pullback typically brings RSI down to the 40-50 zone. If RSI dips to this area and then starts to turn back up, it often signals a healthy pullback that’s about to end. That’s your sweet spot—not oversold (below 30), which would suggest weakness, but not overbought either. Just a healthy reset.
Conversely, if RSI stays weak or diverges negatively (price makes a higher high but RSI makes a lower high), that’s a warning sign. The momentum might not support the trend continuing.
Lower Timeframe Confirmation
Sometimes, zooming into a faster chart—like a 1-minute if you’re watching the 5-minute, or a 5-minute if you’re watching the 15-minute—can show the turn happening earlier. Maybe a mini-breakout or MA crossover on the lower timeframe right at your key support zone. This gives you an earlier entry signal while still respecting the higher timeframe trend.
The Entry Trigger: Don’t just enter on the signal candle itself. A common technique is to wait for the signal candle to close, confirming the pattern, and then place your buy order slightly above the high of that signal candle. This ensures that momentum is actually starting to shift back in your favor before you commit capital.
The ABC Pullback Pattern: Understanding Two-Legged Moves
Here’s a pattern that shows up constantly in pullback trading, and once you know it, you’ll see it everywhere. It’s called the ABC pullback, and it’s based on a simple observation: most pullbacks have two legs, not just one straight move.

How it Works:
- A: The initial counter-trend move. Price starts pulling back from the trend.
- B: A small with-trend move. Price pauses the pullback and makes a brief move back in the trend direction. This is often where impatient traders think the pullback is over and jump in too early.
- C: The second counter-trend move. Price resumes the pullback, often to a deeper level than where A ended.
Why This Matters: The market commonly tries to do something twice. If the first move (A) fails to reverse the trend, and the second attempt (C) also fails, that’s when the original trend is likely to resume strongly. The C-point is often the highest-probability entry for pullback traders.
Think of it like testing a door. The market tests support once (A), backs off, then tests it again (C). If support holds the second time, buyers have more conviction to push price back up. The failed second attempt is your green light.
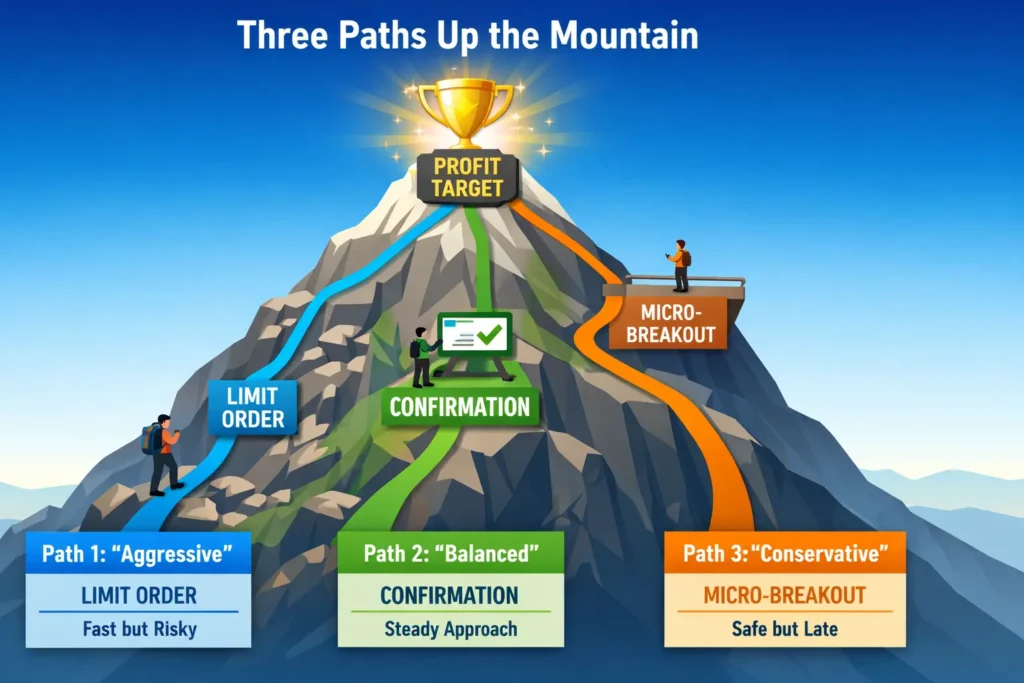
Three Entry Techniques for Pullback Traders
Not all entries are created equal. Here are three different approaches, each with different risk/reward profiles. Pick the one that matches your trading personality:
1. Limit Orders at Support (Aggressive)
How it Works: You place a buy limit order at your identified support level before price gets there. You’re essentially saying, “If price gets to this level, I want in.”
Pros: You get the absolute best price. Your entry is at or near the bottom of the pullback, giving you maximum profit potential if the bounce happens.
Cons: Price might not reach your level—it could bounce early, and you miss the trade entirely. Or worse, price slices right through your level, fills your order, and keeps going down. You need a very strong support zone and tight stop for this approach.
Best For: Experienced traders with high conviction in specific levels, or when trading liquid markets where you can exit quickly if wrong.
2. Confirmed Entry (Conservative)
How it Works: You wait for price to hit the support zone AND show confirmation—a bullish candlestick pattern, increasing volume, or RSI turning up—before entering. You might enter on a break above the high of the confirmation candle.
Pros: Higher probability of success because you have evidence that support is actually holding and buyers are stepping in. You avoid getting caught in a “falling knife” scenario.
Cons: Your entry price is worse than with a limit order. You’re giving up some profit potential in exchange for higher probability. Sometimes the move is so fast off the support that by the time you get confirmation, the best part of the bounce is already done.
Best For: Most traders, especially those still developing their feel for the market. This approach balances risk and reward effectively.
3. Micro-Breakout Entry (Balanced)
How it Works: During the pullback, price creates a small consolidation or mini resistance level. You wait for price to break above this short-term resistance, signaling that the pullback is ending and the trend is resuming.
Pros: Confirmation that momentum is actually shifting back in the trend’s direction. You’re buying strength, not weakness. Less risk of catching a falling knife.
Cons: Similar to confirmed entry—your price isn’t as good as a limit order. You need to be quick to spot these micro-breakouts forming.
Best For: Traders who like a balance between confirmation and getting a decent entry price.
Finding Pullback Setups: Scanners & Tools That Actually Work
Look, you can manually scan charts all day looking for pullback setups, but that’s time-consuming and you’ll miss opportunities. Smart traders use scanners to do the heavy lifting. Here’s how to find high-probability pullback setups efficiently:
Trade Ideas: The AI-Powered Pullback Scanner
Our team has tested dozens of scanners, and Trade Ideas consistently finds the best pullback setups. Here’s why it’s become our go-to:
OddsMaker AI: This feature analyzes each setup and gives you a probability score for success based on historical data. When you’re looking at a pullback to the 50 EMA, OddsMaker tells you: “This setup has worked 68% of the time historically.” That’s powerful intel.
Custom Pullback Filters: You can build scans specifically for pullback setups. For example:
- Price is above 50 EMA (confirming uptrend)
- Price has pulled back to within 1-2% of the 50 EMA
- Volume today is above average (confirming participation)
- RSI is in the 40-50 range (healthy pullback zone)
Real-Time Alerts: The scanner alerts you the moment a stock meets your criteria. You don’t have to sit and watch—Trade Ideas does the watching for you and pings you when opportunities appear.
For a complete breakdown of how we use Trade Ideas for pullback trading, check out our in-depth Trade Ideas Review.
TrendSpider: Multi-Timeframe Analysis Made Easy
TrendSpider excels at multi-timeframe analysis, which is crucial for pullback trading. You need to see the bigger trend on the daily chart while executing on pullbacks on the 5-minute or 15-minute chart.
Automated Trendline Drawing: TrendSpider automatically draws trendlines for you and alerts when price approaches them. No more manually drawing lines and hoping you got them right.
Multi-Timeframe Scanner: View multiple timeframes simultaneously to see where price is in the larger context while spotting short-term pullback entries.
TradingView: Charting and Fibonacci Tools
TradingView is our charting platform of choice for its clean interface and excellent Fibonacci tools. You can:
- Quickly draw Fibonacci retracements
- Set alerts when price hits specific Fib levels
- Overlay multiple moving averages to spot confluence zones
- Share charts with trading buddies for second opinions
The combination of Trade Ideas for scanning, TrendSpider for multi-timeframe context, and TradingView for charting and analysis creates a powerful toolkit for pullback traders.

When Pullback Strategies Work Best (And When They Don’t)
Here’s something critical that doesn’t get talked about enough: pullback trading isn’t a strategy for all market conditions. You need to know when to use it and—just as importantly—when to step aside.
Ideal Conditions for Pullback Trading
Strong, Clear Trends: Pullback trading works best when the trend is obvious and well-established. You want to see a clear pattern of higher highs and higher lows (or lower highs and lower lows in downtrends). If you have to squint at the chart to figure out what direction it’s going, it’s probably not a good pullback candidate.
High Volume and Participation: The best pullback opportunities occur in liquid, actively traded stocks or markets. High volume means there’s strong interest, and when price pulls back, you can be more confident that buyers (or sellers) will step in at support levels. Thin, low-volume stocks can gap right through your support zones.
Healthy, Structured Pullbacks: The pullbacks you want to trade are orderly and respect technical levels. They pull back to logical support areas (MAs, Fib levels, prior support) and show signs of holding. These are different from violent, panicky selloffs.
Trending Market Environment: When the overall market (S&P 500, Nasdaq) is in a trending phase, individual stocks tend to follow suit. Pullback trading in individual names works better when the broader market has your back.
When to Avoid Pullback Trading
Choppy, Range-Bound Markets: When there’s no clear trend, “pullbacks” are really just noise within a range. Price chops back and forth, stops get hit constantly, and there’s no follow-through. If you see a lot of overlapping price action and unclear structure, step aside. Check out our guide on Range-Bound Trading for strategies that work better in these conditions.
News-Driven Volatility: During major news events—earnings releases, Fed announcements, geopolitical crises—technical levels can become meaningless. Price can gap through your carefully identified support zones like they don’t exist. Unless you’re specifically trading the news (which we don’t recommend for most traders—see why in our Trading News Events guide), avoid pullback trades around major catalysts.
Weak Trends or Low Volume: If the trend is weak—barely making new highs or showing poor follow-through—pullbacks are more likely to turn into reversals. Similarly, in low-volume conditions, there might not be enough buyers to absorb the selling pressure during a pullback.
Climactic Exhaustion Moves: When you see a vertical, parabolic move up on huge volume, the subsequent pullback might be the start of a major correction or reversal, not a healthy dip to buy. These “blow-off top” moves often lead to sharp reversals, not bounce opportunities.
The discipline to sit on your hands during unfavorable conditions is just as important as the skill to execute during favorable ones.
Setting Your Stops and Targets for Pullbacks
Okay, you got your confirmation, you entered the trade. Now what?
Stop Loss Placement: Protect Your Capital
Your stop needs to be placed at a logical point that invalidates your trade idea if hit. Common spots for pullback trades:
Just Below the Low of the Pullback/Signal Candle: This is often the tightest logical stop. If price breaks below the candle that signaled the reversal, your reason for entry is likely wrong. This gives you the best risk/reward ratio but means you might get stopped out on a quick whipsaw.
Just Below the Support Zone Itself: Give yourself a bit more breathing room by placing your stop below the MA, Fib level, or support zone you used for entry. This accounts for brief violations (stop hunts) before the bounce happens. The trade-off? A wider stop means you need a smaller position size for the same dollar risk.
NEVER use an arbitrary dollar amount stop like “I’ll risk $100 on this trade.” That’s not how professional traders operate. Base your stop on the price structure—where does the setup become invalidated? That’s where your stop goes. Then adjust your position size based on that stop distance to risk your desired percentage of capital. Learn more about this in our Position Sizing guide.
Profit Targets: Know When to Take Chips Off the Table
Where are you aiming?
New High (Uptrend) / New Low (Downtrend): The most obvious target is for the trend to resume and make a new swing high or low. This makes sense—you’re trading a pullback in a trend, so you expect the trend to continue.
Measured Move: Measure the distance of the previous price leg before the pullback, and project that same distance upwards from the pullback low. For example, if the stock ran $2 before pulling back, look for another $2 move after the bounce.
Fixed Risk/Reward: Aim for a specific multiple of your initial risk. If your stop loss is $0.50 away, aim for a $1.00 or $1.50 profit target for a 2:1 or 3:1 risk/reward ratio. This is the approach we emphasize in our Risk/Reward Ratio guide.
Trailing Stop: As the trade moves in your favor, you can trail your stop loss up—for example, below the rising moving average, or below recent swing lows—to lock in profit while letting the winner run. This is the “let your winners run” approach, and it’s psychologically challenging but crucial for long-term profitability. We dive deep into this in The Psychology of Risk/Reward.
Your Pullback Trading Checklist: Step-by-Step Framework
Alright, let’s tie everything together with a practical checklist you can use for every pullback trade:
✓ Confirm Clear Trend: Is price making higher highs and higher lows (uptrend) or lower highs and lower lows (downtrend)? If you can’t easily identify the trend, walk away.
✓ Identify Confluence Zone: Where are multiple support levels lining up? Look for MAs + Fibonacci + previous support all in the same area.
✓ Wait for Price to Reach Zone: Patience. Don’t chase. Let the trade come to you.
✓ Check Volume During Pullback: Is volume decreasing as price pulls back? That’s healthy. Heavy volume on the dip might signal more serious trouble.
✓ Look for Confirmation: Bullish candlestick pattern? RSI turning up from 40-50? Volume increasing on the bounce?
✓ Enter with Precise Trigger: Don’t just market buy. Use a limit order above the signal candle high or wait for micro-breakout.
✓ Set Logical Stop Loss: Below the signal candle low or below the support zone. No arbitrary stops.
✓ Define Profit Target: New high, measured move, or fixed R:R. Know your exit before you enter.
✓ Execute with Discipline: Follow your plan. Don’t adjust your stop lower because “you need more room.” That’s how accounts blow up.
This checklist keeps you systematic and removes emotional decision-making.
Common Pullback Trading Mistakes (And How to Avoid Them)
Pullback trading sounds great in theory, but there are traps waiting to snare you. Watch out for these:
The Pullback That Keeps Pulling
Sometimes, what looks like a pullback is actually the start of a full-blown trend reversal. Price slices through your support zone, hits your stop, and keeps going. That’s why the stop loss is essential! You can’t avoid every losing trade—they’re part of the game—but you can ensure that when you’re wrong, the damage is limited.
Missing the Entry
You wait for confirmation, but price takes off from the support zone so fast you miss your entry trigger. This one stings, but here’s the truth: Do NOT chase it! Wait for the next setup. Chasing is a recipe for bad entries and losses. There will always be another pullback, another opportunity. The market gives setups every single day.
Fake Confirmation
Sometimes you get a bullish candle pattern that immediately fails on the next candle. A hammer forms, you get excited, you buy the break of its high… and then sellers come right back in and push it lower. It happens. This is why you need that stop loss and why you can’t risk too much on any single trade. Even the best setups fail sometimes.
Analysis Paralysis
So many potential support levels! Which one matters most? Should I wait for the 50 EMA or the Fib level? Here’s the fix: Keep it simple. Stick to the key levels defined in your trading plan—for example, “I only trade pullbacks to the 20 EMA or 50 EMA when the 200 EMA confirms the trend.” Don’t overcomplicate it. Pick your favorite 2-3 setups and become an expert at those.
Pulling It All Together: Patience, Plan, Precision
Trading pullbacks successfully boils down to three core principles:
Patience: Wait for the trend. Wait for the pullback to your predetermined zone. Wait for confirmation. Most of trading is waiting. The traders who can’t wait—who always need to be in a trade—are the ones who blow up accounts.
Plan: Have a clear, written plan for what you’re looking for. What trend structure do you need to see? Which support zones are you watching? What confirmation signals will you wait for? Where will your stop go? Where’s your target? If you can’t answer these questions before entering the trade, don’t enter.
Precision: When your setup appears, execute precisely according to your plan. Not kind of like your plan. Not mostly like your plan. Exactly according to your plan. This is what separates professionals from amateurs.
It takes practice to get a feel for identifying good pullback zones and reliable confirmation signals. Start by watching price action around key MAs on your charts. Paper trade the setups first—seriously, use a simulator. Journal every attempt. Note what worked and what didn’t. Over time, you’ll develop a better eye for catching those high-probability entries within the trend’s flow.
Remember: you’re not trying to catch every move. You’re trying to catch the high-probability moves that align with your specific setup criteria. Quality over quantity.

Article Sources
Our analysis is supported by research from leading financial authorities:
Investopedia – Comprehensive definition and characteristics of pullbacks as temporary 5-10% declines within trends driven by profit-taking.
The Street – Analysis of pullback psychology, noting that shorter-term traders take profits while longer-term investors hold based on fundamentals.
CFA Institute – Behavioral Finance Research – Academic research on trader psychology, loss aversion, and the disposition effect that drives profit-taking behavior.
George Washington University Law School – Scholarly analysis of market psychology and behavioral factors in price movements.
Nasdaq – Technical analysis framework for identifying pullbacks versus reversals using moving averages and support levels.
Phemex Academy – Detailed comparison of pullbacks, retracements, and reversals with technical indicator applications.
Frequently Asked Questions About Pullback Trading
What is pullback trading in stocks?
Quick Answer: Pullback trading is a strategy where you buy during temporary price dips within an ongoing uptrend (or sell during temporary rallies in a downtrend), aiming to enter the trend at better prices before it resumes.
Pullback trading capitalizes on the natural rhythm of markets. Instead of chasing a stock after it’s already made a big move, you wait for it to pull back to a support level—like a moving average, Fibonacci level, or previous resistance—show confirmation that buyers are stepping back in, and then enter. The key is that you’re trading with the dominant trend, not against it. You’re just timing your entry during a temporary pause.
Key Takeaway: Pullback trading offers better risk/reward than chasing, but requires patience to wait for the right setup. Learn more about different day trading strategies to find your style.
How do you identify a pullback in trading?
Quick Answer: Identify pullbacks by confirming the dominant trend first (higher highs and lows), then watching for temporary counter-trend moves to key support levels like moving averages, Fibonacci retracements (38.2%, 50%, 61.8%), or previous support/resistance zones.
The process is systematic: First, confirm you have a clear trend—price making consistent higher highs and higher lows for an uptrend. Second, identify your key support zones using technical tools like the 20 EMA, 50 EMA, Fibonacci retracements, or horizontal support levels. Third, wait for price to pull back to these zones. Fourth—and this is crucial—wait for confirmation before entering. A pullback isn’t a pullback until buyers actually step in and defend the level.
Key Takeaway: Use confluence (multiple support levels aligning) for the highest-probability pullback zones. Our guide on support and resistance covers the fundamentals.
What is the difference between a pullback and a reversal?
Quick Answer: A pullback is temporary (days to weeks) and maintains the trend structure, while a reversal is a complete trend change that breaks key support levels and establishes a new opposite trend.
Think of a pullback as the market catching its breath—price dips but the overall trend structure stays intact (higher lows in an uptrend). A reversal is when the trend actually ends. In an uptrend reversal, price breaks below major support, starts making lower highs and lower lows, and a downtrend begins. The key difference: pullbacks respect major support levels (like the 50 MA or 200 MA) and resume quickly. Reversals violently break through these levels on high volume and don’t look back.
Key Takeaway: If price breaks major support decisively, it’s probably a reversal, not a pullback. Our spotting reversals guide shows you the warning signs.
How do you trade pullbacks with Fibonacci?
Quick Answer: Draw Fibonacci retracement from the swing low to swing high of the recent trend move, then watch for price to pull back to key levels (38.2%, 50%, 61.8%) and show confirmation before entering in the direction of the original trend.
Here’s the step-by-step: In an uptrend, identify the most recent significant swing low and swing high. Use your charting platform’s Fibonacci tool to draw from that low to that high. The tool plots horizontal lines at 23.6%, 38.2%, 50%, 61.8%, and 78.6%. The most important levels for pullback trading are the 38.2%, 50%, and 61.8%. Watch for price to pull back to one of these levels. When it does, look for confirmation—bullish candlestick patterns, increasing volume, or RSI bouncing from the 40-50 zone. Don’t just blindly buy at the Fib level; wait for evidence that support is actually holding.
Key Takeaway: Fibonacci works best when combined with moving averages or previous support levels for confluence. A Fib level that aligns with the 50 EMA is much more powerful than a Fib level in isolation.
What are the best indicators for pullback trading?
Quick Answer: The best indicators for pullback trading are moving averages (20 EMA, 50 EMA), Fibonacci retracements, RSI (watch for 40-50 zone bounces in uptrends), and volume analysis (decreasing on pullback, increasing on bounce).
Each indicator serves a specific purpose in your pullback trading system. Moving averages identify the trend and provide dynamic support levels. Fibonacci retracements help you measure how deep a pullback might go. RSI shows you momentum—in a healthy uptrend pullback, RSI typically dips to 40-50 (not oversold) then turns back up. Volume confirms the quality of the pullback: light volume on the dip suggests weak selling, while increasing volume on the bounce shows conviction from buyers.
Key Takeaway: Don’t rely on just one indicator. Use multiple tools to confirm your setup. Our basic indicators guide covers the essentials.
How do you confirm a pullback is ending?
Quick Answer: Confirm a pullback is ending by watching for bullish candlestick patterns (hammer, engulfing) at support, increasing volume on the bounce, RSI turning up from 40-50 zone, and price breaking above short-term resistance.
Confirmation is what separates profitable pullback traders from those who catch falling knives. You need multiple pieces of evidence that buyers are stepping back in. First, look for the pullback to reach a logical support zone (MA, Fib level). Second, watch for a bullish candlestick signal—a hammer, bullish engulfing, or morning star pattern. Third, check that volume is picking up as price starts to bounce. Fourth, see if RSI (which should have dipped during the pullback) is starting to turn back up. Finally, many traders wait for price to break above a small resistance level that formed during the pullback itself. This micro-breakout confirms momentum is shifting back to the bulls.
Key Takeaway: Never enter on hope alone. Wait for concrete evidence that the pullback is ending. Patience in waiting for confirmation dramatically improves your win rate.
Can pullbacks turn into reversals?
Quick Answer: Yes, pullbacks can turn into reversals, which is why stop-loss placement below key support levels is essential. Watch for breaks of major support (50 MA, 200 MA), increasing volume on the breakdown, and breakdown of trend structure as warning signs.
This is the risk every pullback trader faces. What looks like a healthy dip can occasionally turn into the start of a new downtrend. That’s why risk management is non-negotiable. Your stop loss protects you when a pullback turns ugly. The warning signs: Price slices through your support zone without respect. Volume picks up on the breakdown (institutional selling). Price starts making lower highs and lower lows, breaking the uptrend structure. If you see these signs, your stop will get you out with a manageable loss. That’s exactly what it’s designed to do.
Key Takeaway: Accept that not every pullback will work out. Proper risk management ensures that when you’re wrong, the damage is limited.
What is the buy the dip strategy?
Quick Answer: “Buy the dip” means purchasing an asset when its price temporarily declines within an uptrend, expecting the trend to resume and price to move higher. It’s the uptrend version of pullback trading.
The buy the dip strategy is rooted in the observation that markets don’t move in straight lines. Even in the strongest uptrends, profit-taking causes temporary dips. Smart traders use these dips as buying opportunities, entering the trend at better prices than those who chased it at the top. The key is identifying that you’re actually in an uptrend first—buying dips in a downtrend is a recipe for disaster. Once you confirm the uptrend, you wait for pullbacks to support levels, look for confirmation that buyers are returning, and enter with a tight stop below support.
Key Takeaway: “Buy the dip” only works in confirmed uptrends. In choppy or downtrending markets, dips keep dipping. Always confirm the trend first with our trend identification guide.
Disclaimer: Trading and investing carry inherent risks, including the potential loss of capital. The strategies, examples, and information presented in this article are for educational purposes only and should not be construed as financial advice. Past performance does not guarantee future results. Always conduct your own research, understand the risks involved, and consider consulting with a licensed financial advisor before making any trading decisions. For complete terms and conditions, please visit our full disclaimer.


